
.svg)
.svg)
.svg)
If you're looking to improve your sales success, a well-structured pipeline in sales is your secret weapon.
Did you know that businesses with strong sales pipeline management experience 28% more revenue growth? (Source: HubSpot).
In this guide, you'll uncover proven strategies to build and refine your sales pipeline, making buying process of your deal closures smoother and faster.
What is a Sales Pipeline?

A sales pipeline is a visual way to track the journey of a deal from the start to the finish. It helps sales teams see where each opportunity is in the sales process.
Each step of sales funnel shows how close the next stage of a sale is to being finalized. Businesses use sales pipelines to manage and grow their sales effectively.
Importance of a Sales Pipeline Report in Sales Process
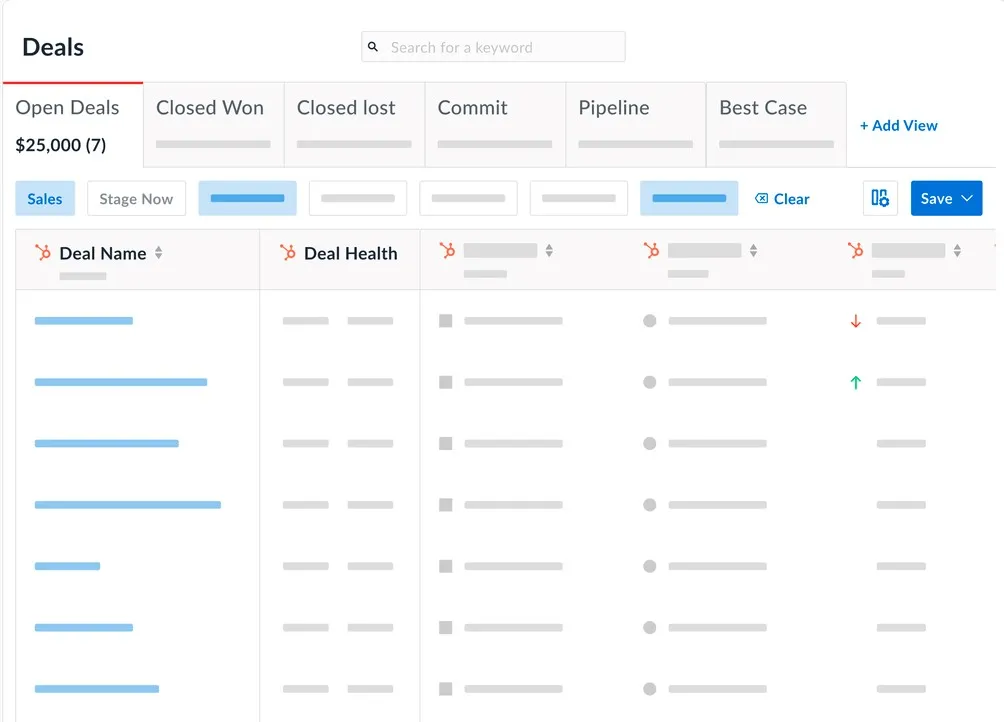
1. Provides Clear Visibility of Sales Progress
- A sales pipeline report shows exactly where each deal is.
- It helps sales managers and teams know which deals are moving forward and which ones are stuck. This makes it easier to plan and focus on closing more deals.
2. Helps Identify and Resolve Bottlenecks
- Sometimes, deals get stuck. A good sales pipeline report helps you see where things slow down. By spotting these bottlenecks, you can find quick solutions to keep the deals moving.
- For example, if many deals are delayed in the "negotiation" stage, you can train your sales reps to handle objections better.
3. Improves Sales Forecasting Accuracy
- Sales pipelines make it easier to predict future sales. By looking at past trends and current deals, businesses can estimate how much revenue to expect.
- This way, sales leaders can set realistic sales targets and plan better for the future.
4. Enhances Team Accountability and Performance
- Each part of the sales process is connected to specific sales activities. Sales pipeline reports make it clear who is responsible for each step.
- This helps teams stay focused and accountable. Knowing that their actions are tracked encourages sales reps to give their best performance.
5. Facilitates Data-Driven Decision-Making
- Sales pipeline reports provide real data, not just guesses. This data helps managers make smart decisions.
- For example, if the data shows that deals close faster when sales reps follow up within two days, teams can adjust their process to do that every time.
Strategies to Build a Sales Pipeline Report

1. Identify Key Metrics and Define Reporting Goals
Start by choosing the most important numbers (metrics) to track in your sales pipeline. Examples include the top target revenue, number of deals, sales targets, and conversion rates. Setting clear goals for your report helps your sales team understand what they should focus on.
Why It’s Important:
If you don’t track the right metrics, you might miss out on key details that can boost your sales.
For example, if your report focuses only on the total number of deals without showing how many deals are stuck, it becomes hard to improve sales team performance. Sales managers need accurate data to make smart decisions.
How to Implement:
- Decide what metrics matter most to your business, such as how many deals are at each stage or the average sales cycle.
- Set reporting goals. For example, you might want to increase the pipeline value by 10% every month.
- Make sure your sales pipeline report highlights these key metrics clearly.
2. Segment the Pipeline by Lead Sources
Break down your sales pipeline based on where your leads come from (like email campaigns, social media, or referrals). This is called segmenting. It gives you a clearer picture of which sources bring in the most of potential buyers and customers.
Why It’s Important:
When you know which lead sources work best, you can focus your efforts there. For example, if your data shows that most deals come from social media, you can spend more time on social media marketing.
This helps in planning your marketing team’s strategies and ensures that sales reps work on the right leads.
How to Implement:
- Use your sales pipeline data to sort leads by their sources.
- Include separate sections in your report for each source. For example, create categories like “Email Leads,” “Website Leads,” and “Events.”
- Track how these leads move through the pipeline to see which source converts the best.
3. Use Visuals to Highlight Data Trends
Visuals like charts and graphs make it easy to understand sales data. Instead of looking at a long list of numbers, a visual can quickly show you where deals are increasing or slowing down. For example, a bar chart can show how many deals closed in each sales pipeline stage.
Why It’s Important:
Visuals help sales teams and sales leaders see the bigger picture at a glance. They can quickly spot trends, such as if there are more deals in one part of the sales cycle than another.
It also makes it easier to explain data to company executives who might not be familiar with all the details of sales pipeline reporting.
How to Implement:
- Use line graphs to show sales growth or a pie chart to display the percentage of deals at each stage.
- Add colors to highlight important information, like red for stalled deals and green for deals that are moving forward.
- Make your sales pipeline reports easy to read, so everyone can understand the data.
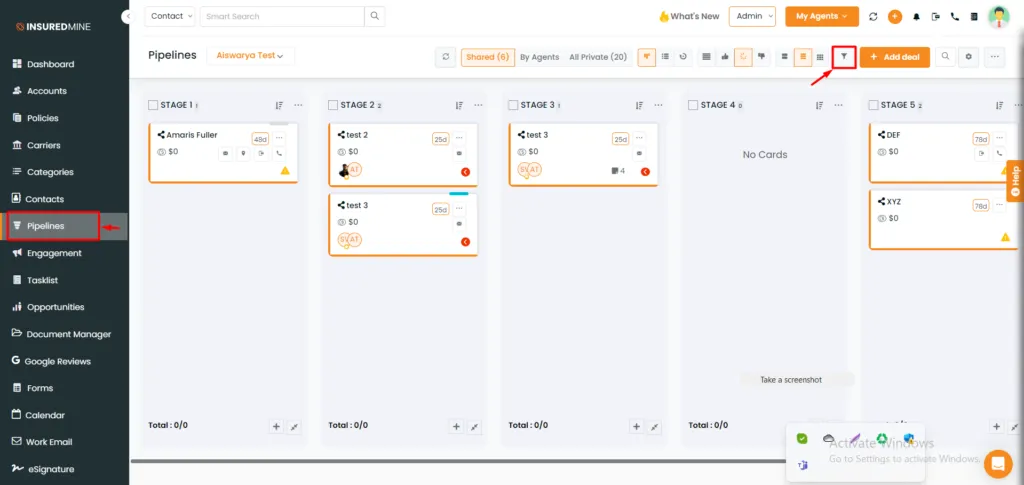
4. Track Progress by Sales Stages
Sales stages are the different steps a deal goes through, from the first contact to closing. Tracking average deal value progress by these stages means checking how many deals are in each step of the sales process.
Why It’s Important:
This helps sales managers see where most of the deals are and if any stages need more attention. For example, if many deals are stuck in the "negotiation" stage, it may mean your sales reps need better tools to close deals.
Tracking sales stages also makes it easier to predict how many deals will close, improving your sales forecast.
How to Implement:
- Divide your sales pipeline into stages, such as “Initial Contact,” “Demo,” “Negotiation,” and “Closed Deal.”
- Use your sales pipeline report to count how many deals are in each stage.
- Check the report regularly to see if any stage is slowing down. For instance, if deals are piling up at one stage, it's a sign to take action, like providing extra training or support to your sales reps.
5. Incorporate Time-Based Analysis
Time-based analysis means looking at how long deals spend in each sales pipeline stage. This helps you understand your average sales cycle, which is the typical time it takes to close a deal from start to finish.
Why It’s Important:
If deals take too long to move from one stage to the next, it can hurt your sales team's performance. By tracking the time, you can find out where deals are getting stuck and fix those problems.
For example, if deals usually take 10 days to move past the demo stage but are now taking 20 days, it's time to check what's causing the delay.
How to Implement:
- Use your pipeline reports to track the time deals spend in each stage. Create averages for how long deals usually take to move through the sales pipeline.
- Compare the time for current deals with past deals. Look for any unusual delays.
- If certain stages are taking too long, consider why. It could be that sales reps need more training or better tools. Adjust your sales activities to help deals move faster.
6. Highlight Stalled Deals and Follow-Up Actions
Stalled deals are deals that have stopped moving forward in the pipeline. Highlighting these other deals in your pipeline means showing which deals have been inactive for a while. Once identified, you can plan follow-up actions to get them moving again.
Why It’s Important:
Stalled deals are often missed opportunities. Many sales reps might assume the deal is lost and move on. But sometimes, all it takes is a simple follow-up call or email to reignite interest.
Sales managers who pay attention to stalled deals can help sales professionals on their team recover those sales and meet their sales targets.
How to Implement:
- Use your sales pipeline reports to spot deals that have been inactive for a set number of days. For example, if a deal hasn’t moved in 14 days, it’s considered stalled.
- Create a plan for following up. This could mean sending a personalized email, offering a discount, or scheduling a follow-up call.
- Make sure your sales team knows how important it is to follow up. Regularly review stalled deals during team meetings and encourage reps to take action.
7. Integrate Sales Activities and Engagements
Sales activities include tasks like calls, emails, meetings, and demos to existing customers. Integrating these activities into your sales pipeline report means showing how each engagement affects the progress of a deal.
Why It’s Important:
This helps sales managers see which activities lead to successful deals. For example, if a sales rep closes more deals after follow-up calls, then you know follow-ups are crucial. Understanding these activities allows your sales manager and team to focus on the actions that get results.
How to Implement:
- Track every sales activity in your pipeline reports, including emails, meetings, and phone calls.
- Use the data to find patterns. For instance, if deals close faster when more meetings are scheduled, encourage your sales reps to set up more meetings.
- Integrate this information with your CRM (Customer Relationship Management) system so you can see which sales activities lead to closing deals.
8. Segment Reports by Sales Reps’ Performance
Segmenting means breaking down data into smaller parts. In this case, it means showing how each sales rep performs. This can include metrics like the number of deals closed, sales targets achieved, and sales cycle time.
Why It’s Important:
This helps you understand the strengths and weaknesses of your sales team. For example, if one rep is great at closing deals quickly, they might share their techniques with the rest of the team.
Segmenting performance also makes it easier for sales managers to offer coaching to those who need it. Plus, it motivates sales reps when they see their hard work reflected in the data.
How to Implement:
- Use pipeline reports to track key metrics for each sales rep, like how many deals they’ve closed and how long it takes them to close a deal.
- Compare performance across your sales team. Highlight the top performers and analyze what they’re doing right.
- Share these insights in team meetings. This encourages healthy competition and allows all sales reps to learn from the best practices.
9. Create Customizable Report Templates
Customizable templates let you set up reports based on your business needs. You can choose what data to include, like sales activities, sales pipeline reviews and stages, or sales targets.
Why It’s Important:
Not all sales teams work the same way, so having a one-size-fits-all report isn’t always helpful.
Customizable templates allow sales managers to focus on specific parts of the sales process that matter most to their team. It saves time and ensures that the reports are always clear and easy to understand.
How to Implement:
- Design templates that can be adjusted for different sales pipeline stages or sales activities. For example, a template could focus on how many deals are in each stage of the pipeline.
- Make it easy to add or remove information. For instance, sales managers might want to focus on sales targets one month and sales reps’ performance the next.
- Use software tools that allow you to customize and automate these reports. This way, you can quickly generate a report whenever you need it.
10. Evaluate Win/Loss Ratios
A win/loss ratio compares how many deals you win against how many you lose. It tells you how successful your sales and marketing team really is at closing deals.
Why It’s Important:
Understanding your win/loss ratio helps you find out what’s working and what’s not. For example, if your sales team wins more deals after providing a product demo, you know the demo is effective.
It also shows which sales strategies need improvement, allowing sales managers to provide better coaching.
How to Implement:
- Track how many deals were won and lost over a specific period, like a month.
- Use your sales pipeline reports to see patterns. For example, are there certain sales reps who have higher win rates? Learn what they are doing right.
- Share this information with your team, and encourage everyone to use the best practices that help close more deals.
11. Track Deal Velocity and Sales Cycle Efficiency
Deal velocity is how fast deals move through your sales pipeline. Sales cycle efficiency means how well your sales process works to close deals quickly. Both metrics tell you if deals are moving smoothly or your sales processes are getting stuck.
Why It’s Important:
If your deals are moving slowly, it can hurt your business. Deals that take too long to close might fall through, costing you time and money. Tracking deal velocity and sales cycle efficiency helps you find out where the slowdowns are.
For example, if deals are slow at the “Negotiation” stage, you can provide your sales reps with better tools to speed things up.
How to Implement:
- Measure how long deals take to move from one stage to the next in your sales pipeline.
- Use your pipeline reports to find out where deals are getting stuck. For instance, if deals are taking longer than usual to close, check if there’s an issue with your sales process.
- Encourage your sales team to keep the momentum going by following up regularly and focusing on leads that show high interest. This will help close deals faster.
12. Compare Forecasted vs. Actual Sale
Comparing forecasted sales to actual sales means looking at your predictions (how much you expected to sell) and comparing them with what you actually sold. This helps you make accurate sales forecast.
Why It’s Important:
Accurate sales forecasts help businesses plan better. They make sure you have enough resources, such as products and sales reps, to meet your goals.
Maybe you overestimated how many deals your sales team could close, or maybe there were unexpected challenges. Knowing this helps you adjust your future plans.
How to Implement:
- Use your sales pipeline data to create sales forecasts. Include details like how many deals are expected to close and the average deal size.
- After a sales period (like a month or quarter), compare the actual sales numbers with your forecasts. Were the numbers close, or was there a big difference?
- Analyze why there were differences. For example, if you didn’t reach your sales targets, was it because deals were taking too long to close or because you didn’t have enough leads? Use this information to improve future forecasts.
Best Practices for Sales Pipeline Reporting

1. Standardize Data Entry Across Teams
Standardizing data entry means making sure everyone enters information the same way. This includes using the same terms, formats, and steps when adding data into the sales pipeline report.
Here’s How to Do It:
- Create clear rules for how sales reps should enter data. For example, if one person writes “lead” and another writes “potential customer,” the data won’t match. Use the same term across the sales team.
- Use drop-down menus in your sales pipeline data entry tools. This helps avoid typing errors and keeps everything consistent.
- Train your sales reps regularly on the importance of proper data entry. This makes sure everyone is on the same page, helping you get accurate sales reports.
2. Focus on Leading Indicators, Not Just Lagging Metrics
Leading indicators are signs that show how sales will perform in the future. Lagging metrics are results that show what happened in the past.
For example, “how many deals are in the pipeline” is a leading indicator, while “how many deals were closed last month” is a lagging metric.
Here’s How to Do It:
- Track data like the number of new leads, sales activities (calls and emails), and deals in each pipeline stage. These indicators help predict future sales.
- Use your pipeline reports to see where deals might be getting stuck. This can help sales managers guide the team before it’s too late.
- Encourage your sales team to focus on the actions that lead to more deals. For example, if more calls result in more deals, set goals for the number of calls each week.
3. Incorporate Predictive Analytics for Future Sales Insights
Predictive analytics uses data to predict future sales trends. It can show you which sales strategies are working and which ones need to change. This helps sales managers and company executives make better decisions.
Here’s How to Do It:
- Use software tools that offer predictive analytics features. These tools can analyze past sales data and give you forecasts on sales pipeline performance.
- Set up your sales pipeline reports to show these predictions. For example, if the report predicts a drop in sales next month, you can adjust your sales strategy to close more deals now.
- Regularly review these insights with your team. Knowing what might happen helps everyone prepare, plan better, and reach their sales targets.
4. Segment Reports by Different Sales Criteria
Segmenting means breaking down your data into smaller, focused parts. For sales pipeline reports, this could mean looking at sales by region, product, or even by individual sales reps.
Here’s How to Do It:
- Use your sales pipeline data to separate information. For example, if you want to see how your sales team is performing in different regions, create a report for each region.
- Look for patterns. If one region is selling more, try to understand why and share those winning strategies with other teams.
- You can also segment by products. This helps sales managers know which products are the most popular, allowing them to plan better.
5. Regularly Review and Update Reporting Metrics
Reporting metrics are the numbers you track to see how well your sales process is working. Regularly reviewing these numbers means checking if they still help you generate sales pipeline reports so you understand your sales pipeline. If not, it’s time to change them.
Here’s How to Do It:
- Set up a schedule to review your sales pipeline reporting metrics, like once every quarter. Check if the numbers you track, such as “how many deals” or “sales targets met,” are still important.
- Update metrics as needed. If you see that tracking new leads is more helpful than tracking old ones, shift your focus.
- Make sure your sales reps understand why these changes are happening. It keeps everyone on the same page and working toward the same sales goals.
Examples of a Winning Sales Pipeline Reports
1. Conversion-Focused Pipeline Report
This report focuses on conversion rate and how many leads turn into sales. It shows you the conversion rates at each stage of your sales process, from initial contact to closing deals.
How to Create It:
- Start by tracking how many deals you have at each stage of the pipeline. For example, you might have 50 leads, but only 10 become paying customers.
- Use this data to find out where most deals are getting stuck. If many deals drop off after the first meeting, you might need to improve your sales pitch.
- Share the report with your sales reps and encourage them to focus on activities that lead to more conversions, like follow-up calls and demos.
2. Sales Velocity Pipeline Report

Sales velocity measures how fast deals move through your sales pipeline. This report helps you see if your sales cycle is quick or if deals are taking too long to close.
How to Create It:
- Track the time it takes for deals to move from one stage to the next. For example, if a deal spends two weeks in the “Negotiation” stage, it might be stuck.
- Use your sales pipeline reports to identify slow points. Maybe deals are taking longer to close because sales reps are waiting too long to follow up.
- Motivate your team to keep deals moving by setting goals for each stage. For example, aim to close deals within 30 days to improve sales velocity.
3. Deal-Value Segmented Pipeline Report
This report segments deals by their value, helping you see which deals are the most profitable. It shows you which deals have a higher value so your sales managers can focus on closing them.
How to Create It:
- Break down your deals by value. For example, group deals into categories: under $1,000, $1,000 - $5,000, and over $5,000.
- Use pipeline data to see which deals are in the higher-value category. Make sure your sales team knows to prioritize these deals.
- Highlight the importance of closing high-value deals by offering incentives. This encourages sales reps to put extra effort into deals that bring in more revenue.
Conclusion
Building an effective sales pipeline includes everyone in sales to close more deals. Use clear reports, track key metrics, and regularly review your sales process. These steps help sales reps, sales managers, and the entire sales team work better together. Apply these best practices, and you’ll see more success in your sales pipeline!