

Most sales plan articles describe what a plan should contain, then hand you a blank table. This one does the opposite. Below is one complete B2B sales plan, built line by line for a realistic company, with every number explained and the arithmetic shown so you can check it. After the worked example you get the method to run on your own numbers, plus a fill-in template. The company and figures are illustrative, so treat each rate as a placeholder to replace with your own data.
What a Sales Plan Is, and the Mistake That Sinks Most of Them
A sales plan is the document that turns a revenue number into the daily actions that produce it. It names the target, who you sell to, how you reach them, how many people you need, and how you will know mid-quarter whether you are on track.
The mistake that sinks most plans is describing instead of calculating. A plan that says "grow revenue 50% through outbound and inbound" is a wish. A plan that says "to book $1.2M in new business we need 395 qualified opportunities, which at our mid-market reply rate means about 3,600 outbound contacts a month, which needs three SDRs" is a plan, because every line forces a real decision about headcount, budget, and time.
So the example below is built as a chain. Each number is derived from the one above it, and you can follow the logic in both directions: top down from the revenue target to the weekly activity, and bottom up from your team's capacity back to what it can realistically produce.
A quick orientation before the numbers:
- A good plan is built net of churn rather than on gross new sales.
- Different customer segments get different math, because they convert and cost differently.
- Pipeline coverage comes from your win rate rather than from a generic rule of thumb.
- The plan has to prove the motion pays for itself, beyond showing the target is reachable.
A Complete Sales Plan Example, Built Line by Line
Meet Arcwork, a fictional B2B SaaS selling an operations tool to mid-market and small-business teams. It is at $2.4M in annual recurring revenue (ARR), sells through a mix of outbound and inbound, and wants to grow this year. Everything that follows is illustrative. The judgment is real; the company is a stand-in so you can see the whole machine without any one firm's private numbers.
Step 1: Set the Target by Engine, Net of Churn
The first correction an experienced sales leader makes is to stop planning on gross new sales. Revenue leaks every year through churn, so the real growth number is what you add after replacing what you lose.
Arcwork keeps about 90% of its revenue year over year (gross revenue retention), so it will lose roughly $240K off its $2.4M base. Three engines fill and grow the bucket: new-logo sales, expansion into existing accounts, and the retention work that slows the leak. Building the target from those engines rather than picking a round number looks like this:
| Engine | Contribution | Note |
|---|---|---|
| New-logo sales | +$1.20M | the funnel planned below |
| Expansion (existing accounts) | +$0.36M | the lowest-cost growth dollar |
| Churn (90% gross retention) | -$0.24M | with a plan to slow it |
| Net growth | +$1.32M | $2.4M to $3.72M, about 55% |
Reading the plan this way changes the conversation. New-logo sales carry most of the growth here only because expansion barely outpaces churn. Lift retention and expansion, and the expensive new-logo engine has to carry less. Those three engines also put net revenue retention near 105%: the $2.4M base loses $0.24M to churn and gains $0.36M from expansion, so the existing base grows before a single new logo is added.
Step 2: Split New Business Into Two Tiers
Arcwork sells to two kinds of buyer, and they behave nothing alike. Small businesses buy a cheaper plan quickly, mostly after finding Arcwork themselves. Mid-market teams buy a larger plan slowly, mostly after a rep reaches out. Planning them with one blended win rate hides the truth, so each tier gets its own math.
A qualified opportunity, in this plan, means one specific thing: a named buyer who has confirmed a problem Arcwork solves, a rough budget, and an agreed next step. Anything short of all three counts as a lead rather than an opportunity. That definition keeps every number below honest.
| Tier | Price (ACV) | Customers needed | Win rate | Qualified opportunities | Coverage (1 / win rate) |
|---|---|---|---|---|---|
| Small business (inbound-led) | $6,000 | 60 | 30% | 200 | 3.3x |
| Mid-market (outbound-led) | $24,000 | 35 | 18% | 195 | 5.6x |
| New-logo total | n/a | 95 | about 24% blended | 395 | n/a |
The customer counts come straight from the target: $360K of small-business ARR at $6,000 each is 60 customers; $840K of mid-market ARR at $24,000 each is 35 customers. Divide each by its win rate and you get the opportunities each tier needs.
The coverage column holds the single most useful idea in the plan. Required pipeline coverage follows from your win rate: as a floor, it is 1 divided by your win rate. The old 3x rule assumes you win about a third of your deals, which is higher than many B2B teams achieve. Arcwork wins 30% of small-business deals, so its floor is about 3.3x coverage there, and only 18% of mid-market deals, so about 5.6x. Because deals also slip past the quarter they were meant to close, especially on a 90-day mid-market cycle, treat these as a floor and carry a buffer on top. Blending the two tiers hides more than it helps: weighted by pipeline value, the combined coverage Arcwork needs is about 4.9x ($5.88M of qualified pipeline against the $1.2M target), because mid-market's low win rate and high deal size dominate the dollars. Plan from one blended number set below that, and the mid-market pipeline starves.
Step 3: Turn Opportunities Into Weekly Activity
Opportunities do not appear on their own. Working backward from the mid-market target, here is the outbound engine that produces its 195 opportunities, read from the bottom up as a monthly job.
| Step | Rate (illustrative) | Per month |
|---|---|---|
| Qualified opportunities | n/a | 16 |
| Meetings held | 45% convert to an opportunity | 36 |
| Positive replies | 50% turn into a held meeting | 72 |
| Contacts worked | 2% give a positive reply | 3,600 |
So landing about 16 mid-market opportunities a month takes roughly 3,600 well-researched contacts. The small-business tier runs on inbound instead: about 37 demo requests a month at a 45% qualify rate produce its 200 opportunities a year, which puts the sourcing on the marketing engine rather than the SDR team. Those 37 demos are marketing's number to produce, through content, search, and paid, carried in the plan with a demand-gen budget and a cost per demo, the same way outbound carries a cost per contact. Hold the 3,600 figure: it is about to decide whether the plan is affordable.
Step 4: Staff It, and Account for Ramp and Timing
Now reconcile the target against the people who have to hit it. A ramped mid-market rep at Arcwork closes about $500K a year, so the mid-market number needs about two reps; the high-velocity small-business tier needs one closer feeding on inbound. Two real-world adjustments apply before the headcount is final.
- Attainment. Teams rarely average 100% of quota, so assign more quota than the target. Arcwork assigns about $1.0M across its two mid-market reps to land the $840K that tier needs.
- Ramp. A new mid-market rep reaches full output in about two quarters, so one who starts in the first quarter delivers only part of a full year. If one of the two mid-market reps were a new first-quarter hire, that tier's in-year capacity would fall to about $700K against its $840K target, and the year would land nearer $3.58M than $3.72M. Arcwork resolves it by hiring the second rep a quarter before the plan year, so both are ramped by Q1 and the $840K holds. The honest alternative is to carry the gap and set the target lower.
Timing matters as much as headcount. Mid-market deals take about 90 days, so pipeline created in one quarter mostly closes in the next. Arcwork therefore has to enter the year with roughly a quarter of qualified pipeline already built, about $1.2M of mid-market coverage in hand on day one, and the pipeline its SDRs create late in the year seeds next year rather than this one. The outbound engine runs at full output from week one for that reason.
The resulting team:
| Role | Count | Basis |
|---|---|---|
| Small-business closer | 1 | 60 fast, inbound-fed deals a year |
| Mid-market reps | 2 | ramped quota about $500K each |
| SDRs | 3 | about 3,600 mid-market contacts a month, roughly 1,200 each |
| Customer success / account manager | 1 | owns expansion and retention only |
| Sales manager | 1 | runs both motions |
Step 5: Check That Each Motion Pays for Itself
A target can be reachable and still not worth reaching. Before committing headcount, a sales leader builds the cost from the people in each motion (fully loaded, illustrative). The mid-market engine runs about $620K a year: two reps near $160K each, three SDRs near $70K each, and about $90K of tools and data. The small-business engine runs about $200K: one closer plus a share of inbound and tooling. Divide each by the customers it produces, and against a common SaaS gross margin near 80% the payback splits cleanly by tier. These figures count the direct cost of winning the deal; sales management sits in overhead and customer success is charged against expansion, so neither inflates acquisition cost.
| Motion | Price (ACV) | Cost per customer (CAC) | Payback |
|---|---|---|---|
| Small business (inbound) | $6,000 | ~$3,300 ($200K / 60) | ~8 months |
| Mid-market (outbound) | $24,000 | ~$18,000 ($620K / 35) | ~11 months |
| Expansion (existing accounts) | n/a | a fraction of new-logo | fastest |
One blended cost number would have hidden the real story. Small business is cheap and fast because inbound does the sourcing. Mid-market earns back only just inside a year, because the heavier outbound cost rides on every deal. That is why the reply rate matters so much: lift the mid-market positive-reply rate from 2% to 4%, through a tighter target list, more accurate contact data, and sharper copy, and the outbound volume roughly halves. What that saves depends on a staffing choice. Drop one SDR and the mid-market engine falls from about $620K to $550K, so the cost per customer eases to about $15,700 and payback to about ten months. Keep all three SDRs, and the freed capacity creates more pipeline instead. The reply rate is one of the largest acquisition-capacity levers in an outbound motion, worth testing against win rate and meeting conversion to see which pays back most, which is why it earns its own improvement project. Add customer success and management on top, and the whole sales organization runs near $1.07M a year to add about $1.56M of gross new ARR (new-logo plus expansion), an annualized figure distinct from the revenue recognized within the year.
Step 6: Add the Expansion Engine
Expansion is the engine most plans wave at and then ignore, which is backward, because a dollar from an existing customer is the cheapest dollar you will book. Arcwork gives it a real sub-plan.
- Target: +$360K, about 15% of the $2.4M base, built bottom-up. Of roughly 200 existing customers, about 60 show expansion signals in a year, a third of those convert, and each adds about $18K, which is the $360K.
- Mechanism: seat growth, plan upgrades, and cross-sell, triggered by product usage signals rather than calendar check-ins.
- Owner: the customer success manager, carrying a $360K expansion number kept separate from new-logo compensation.
- Triggers: seat usage past a set threshold, repeated feature-limit hits, a second team adopting the product.
- Retention lever: lifting gross retention from 90% to 92% by flagging at-risk accounts early, worth about another $48K and compounding every year after.
Because expansion dollars carry the lowest acquisition cost, the mature move as Arcwork grows is to shift weight from expensive mid-market outbound toward expansion, which protects the blended cost of acquiring revenue.
Step 7: Set the Cadence and the Review Rhythm
The last section turns the annual plan into a calendar and a weekly habit. New-logo bookings are back-loaded to reflect ramp and the 90-day cycle; expansion builds through the year. Every quarter's bookings reconcile to a specific count of each customer type, so the schedule ties back to the 60 and 35 customers above rather than to round numbers.
| Quarter | Small-business customers | Mid-market customers | New-logo ARR | Expansion |
|---|---|---|---|---|
| Q1 | 10 | 5 | $180K | $60K |
| Q2 | 12 | 8 | $264K | $80K |
| Q3 | 20 | 10 | $360K | $100K |
| Q4 | 18 | 12 | $396K | $120K |
| Total | 60 | 35 | $1.20M | $360K |
Outreach follows an illustrative starting cadence of three to five touches at roughly days 3, 5, 7, 10, and 30, then a clean closing note, with each touch carrying a fresh reason or an easy next step rather than another reminder. The review rhythm watches different numbers at different speeds: weekly on the leading numbers (contacts and positive replies), monthly on the converting numbers (opportunities and coverage by tier), and quarterly on the lagging numbers (bookings, cost of acquisition, and net revenue retention). Watching only bookings means finding out you missed a quarter when it is already too late to fix.
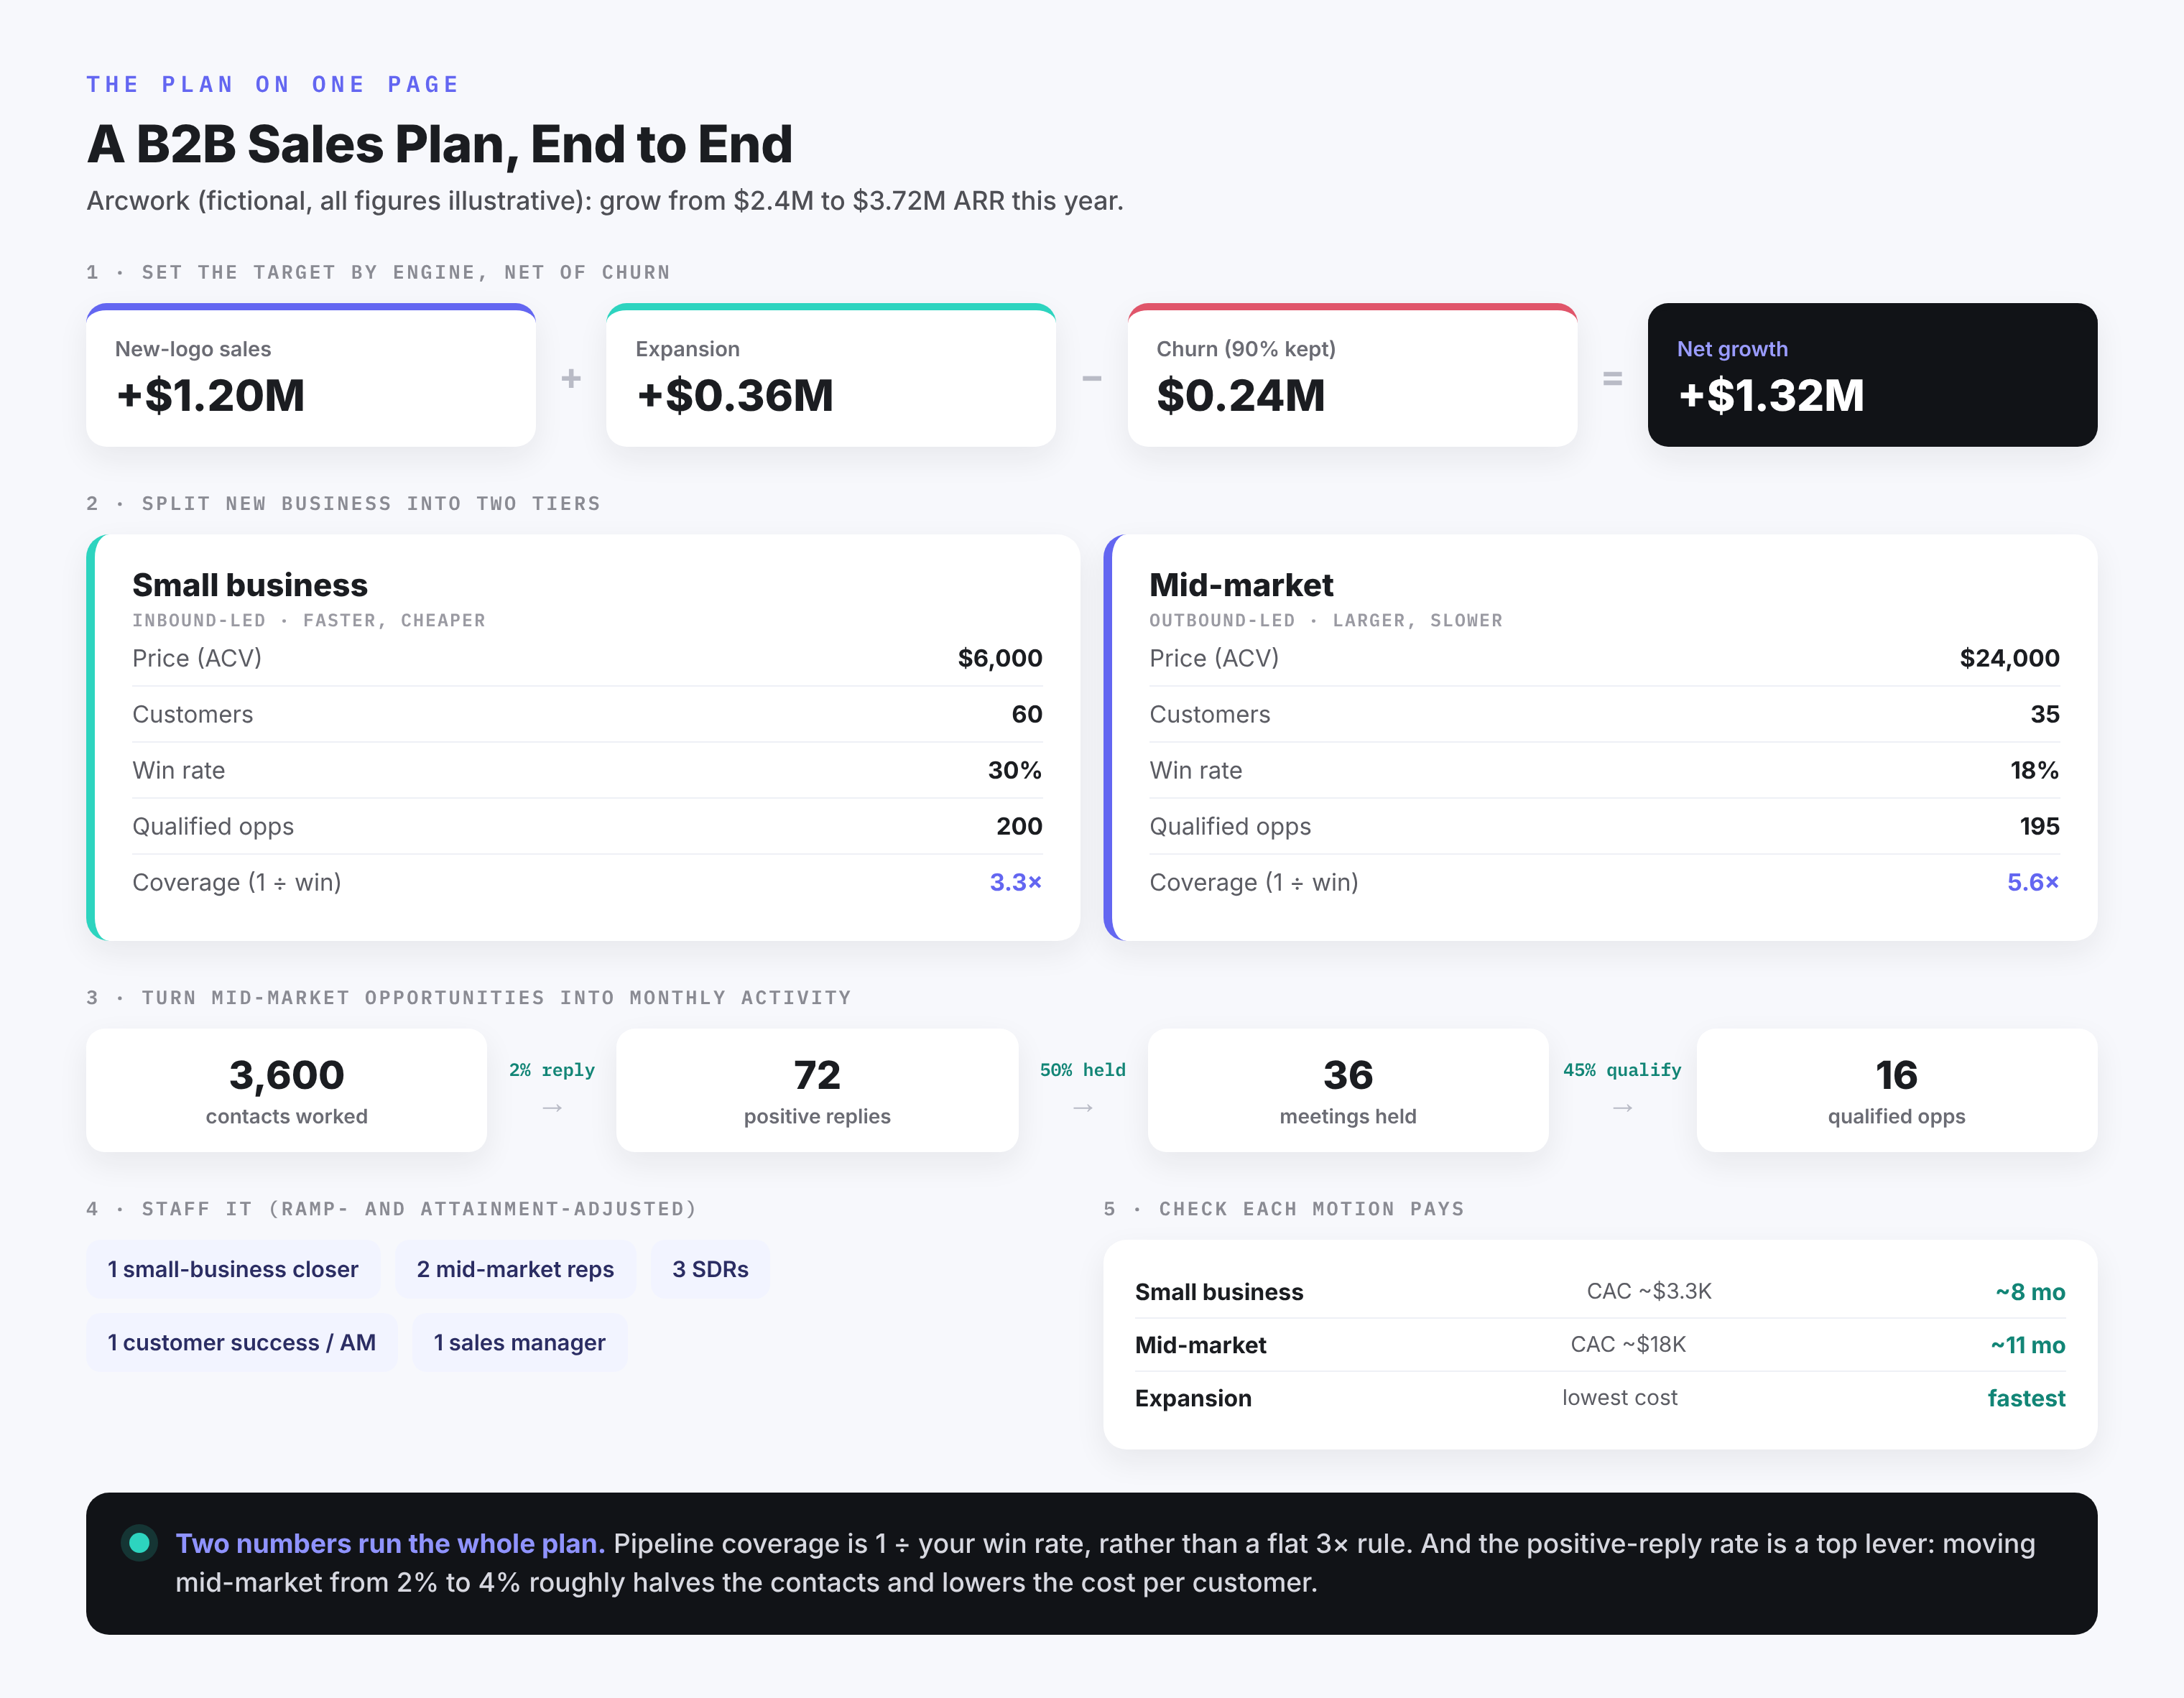
That is the plan's operating core on one page.
The Math Behind the Plan, for Your Own Numbers
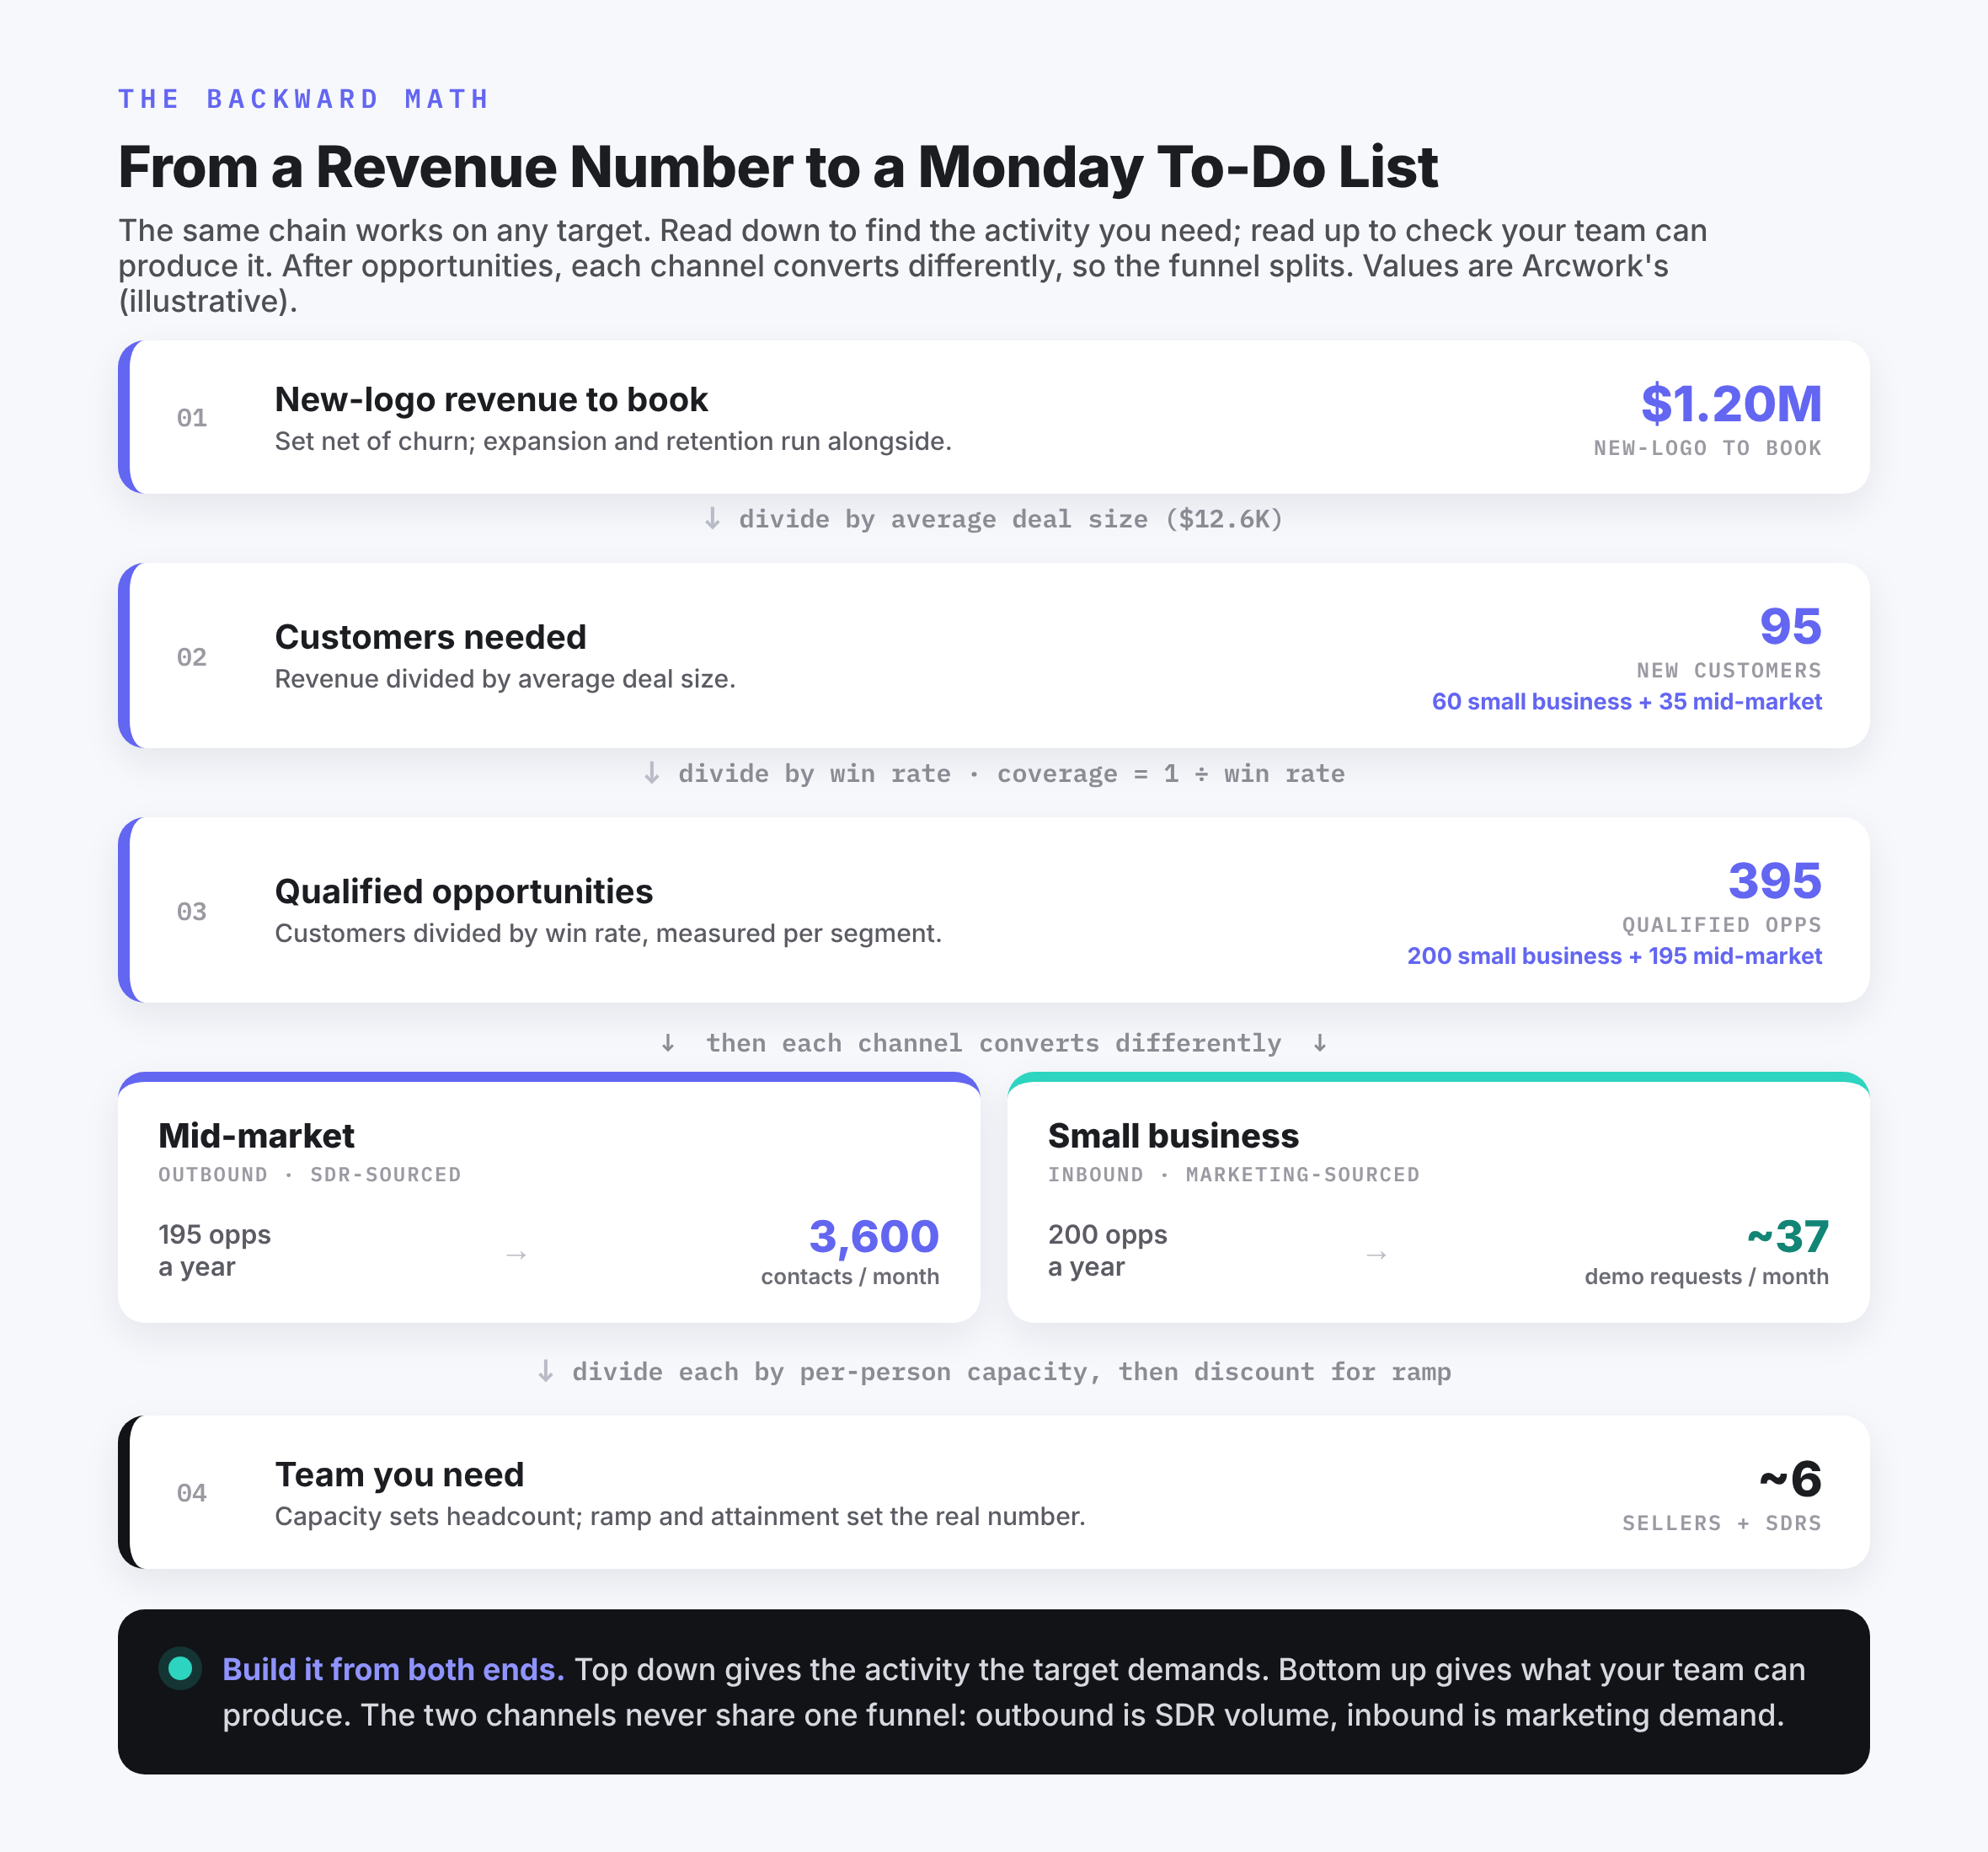
Strip Arcwork away and the method is a short chain you can run on any revenue target. Work down it to find the activity you need, then back up it to check your capacity can produce that activity. Where the two meet is your real plan.
- Start with net growth, then add back churn to get the gross new revenue you actually have to book.
- Divide gross new revenue by your average deal size to get the number of customers.
- Divide customers by your win rate to get qualified opportunities, and remember coverage is 1 divided by that win rate.
- Divide opportunities by each conversion step (meetings, replies) to get the raw activity.
- Divide activity by per-person capacity to get headcount, then discount for ramp and attainment.
The one non-obvious point worth internalizing: the plan is only as trustworthy as its weakest assumed rate. A plan built on a 3% win rate you have never measured is fiction with a spreadsheet attached. Use your own last four quarters wherever you can, and where you cannot, mark the number as an assumption and watch it closely in the first quarter.
The assumptions this plan rests on, each to replace with your own: 90% gross revenue retention, win rates of 30% for small business and 18% for mid-market, a 2% positive-reply rate, a 45% meeting-to-opportunity rate, a 90-day mid-market cycle, and about $500K of ramped capacity per mid-market rep. Every one is a number to measure from your own data rather than inherit.
The Copy-Ready Sales Plan Template
Here is the plan's skeleton as a fill-in template. Copy it, drop in your own numbers, and you have the same chain Arcwork used. Each line names what goes there and the common mistake to avoid.
New-logo ___ plus Expansion ___ minus Churn ___ = Net growth ___
Mistake to avoid: planning on gross new sales and forgetting churn.
2. Segments
For each tier: price (ACV) ___, customers needed ___, win rate ___, opportunities ___, coverage (1 / win rate) ___
Mistake to avoid: one blended win rate across segments that behave differently.
3. Activity math
For each outbound segment: that segment's monthly opportunities ÷ meeting rate ÷ reply rate = contacts needed per month ___
Mistake to avoid: setting an activity target with no conversion rates behind it.
4. Team and capacity
Headcount from capacity ___, then discounted for ramp ___ and attainment ___
Mistake to avoid: using fully-ramped capacity as the year-one number.
5. Economics
Cost per customer ___ vs price ___; payback in months ___
Mistake to avoid: committing headcount before checking the motion pays back.
6. Expansion and retention
Expansion target ___, owner ___, triggers ___; retention goal ___
Mistake to avoid: leaving expansion as an afterthought with no owner.
7. Cadence and review
Quarterly split ___; weekly, monthly, quarterly review numbers ___
Mistake to avoid: reviewing only bookings, too late to change the outcome.
How the Plan Changes by Situation
The chain stays the same; a few inputs move depending on where you are starting.
- New territory or a 30-60-90 plan. The first 30 days are research and pipeline building rather than bookings, so set the activity targets high and the bookings target near zero. Months two and three ramp toward the steady-state math above.
- New product launch. You have no win rate or deal size history, so every rate in the plan is an assumption. Plan conservatively, label the assumptions, and rebuild the plan after the first full quarter of real data.
- A startup's first plan. Skip the two-tier split and plan one motion. Focus the whole plan on steps one to three (target, opportunities, activity), because capacity and economics modeling matters less when you have one or two reps.
- Scaling an existing team. Your rates are known, so the constraint shifts to capacity and ramp. The planning work is mostly in step four: hiring sequence, ramp time, and the pipeline you must carry into each quarter.
The Five Numbers That Decide Everything
If you tune nothing else, tune these, because the whole plan swings on them.
- Win rate. It sets both how many opportunities you need and how much coverage. Measure it per segment from your own closed-won and closed-lost history rather than an industry average.
- Coverage. Set it at 1 divided by your win rate, by segment, rather than a blanket 3x.
- Positive-reply rate. One of the biggest capacity levers in an outbound motion, because small gains cut the required volume sharply. Improve it with targeting and copy, and test it against win rate before deciding where to invest.
- Retention. Gross and net revenue retention decide how much the new-logo engine has to carry. A few points of retention are usually cheaper to win than the equivalent in new logos.
- Ramp and attainment. The gap between what a fully-ramped rep can do and what your actual team delivers this year. Plan the real number rather than the ideal one.
How to Track the Plan
A plan you check once a quarter is a document; a plan you check every week is a system. Keep the review rhythm tiered: weekly on the leading indicators you can still influence (contacts, positive replies, meetings booked), monthly on conversion and pipeline coverage by segment, and quarterly on the outcomes (bookings, cost of acquisition, net revenue retention). When a weekly number drifts, you have time to add activity or fix targeting before the quarter's bookings are set. That early-warning function is the entire point of writing the plan as a chain of rates rather than a single annual goal.
Sales Plan FAQs
Should the target be gross or net of churn?
Net. Plan the growth you want to keep, then add back expected churn to find the gross new revenue you actually have to book. A plan built on gross new sales quietly overstates your progress all year.
Is the 3x pipeline coverage rule still useful?
Only as a rough starting point. The reliable version is 1 divided by your win rate, calculated per segment. A team winning 20% of deals needs 5x coverage, and planning for 3x would leave it short.
How long should a sales plan be?
Short enough that the team reads it and long enough that every number traces back to an action. One page of the chain shown here, plus a segment table and a quarterly split, is usually enough. Aim for a working set of linked numbers rather than a target length.