
.svg)
.svg)
.svg)
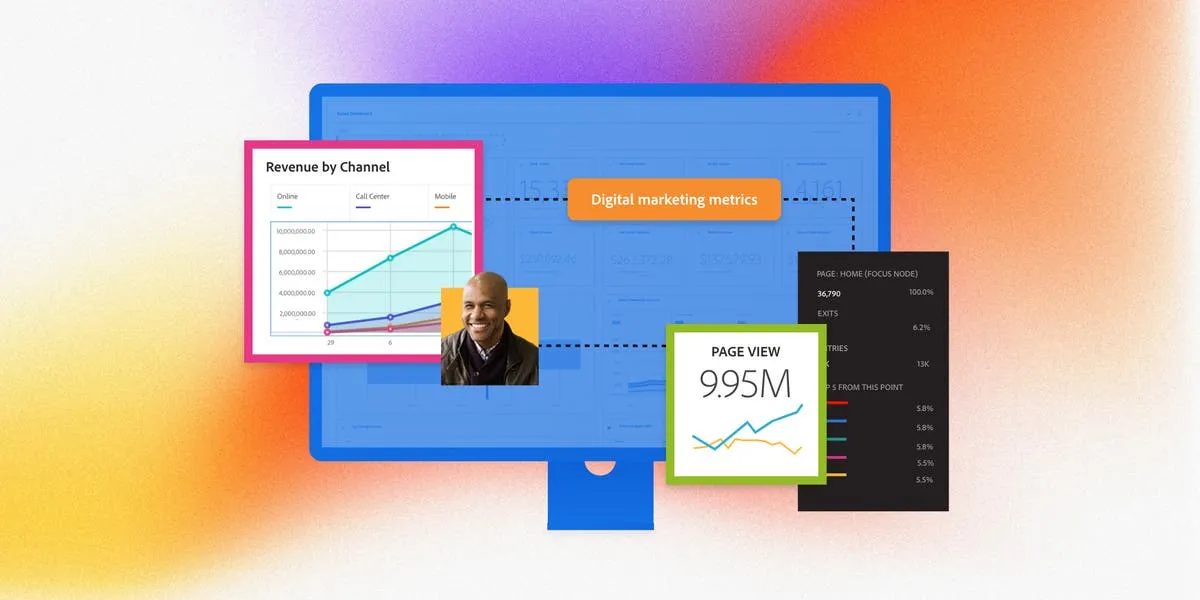
Introduction to B2B Marketing Metrics

What Do You Mean by B2B Marketing Metrics and KPIs
B2B marketing metrics and KPIs (Key Performance Indicators) are quantifiable measures used to evaluate and track the performance and effectiveness of marketing strategies in a business-to-business (B2B) context.
These metrics and KPIs enable organizations to assess the success of their marketing efforts, make data-driven decisions, and align marketing activities with overall business objectives.
Examples include lead generation rates, conversion rates, customer acquisition cost, customer lifetime value, and ROI (Return on Investment). They help in understanding market trends, customer behavior, and the overall impact of marketing campaigns on revenue and growth.
Difference Between Marketing Metrics and KPIs
Importance of Measuring Marketing Performance in B2B
Measuring marketing performance in B2B is crucial for several reasons:
Optimizing Marketing Spend
By tracking metrics such as ROI (Return on Investment) and CAC (Customer Acquisition Cost), companies can understand how effectively their marketing budget is being utilized.
For example, a study by Nielsen found that companies using marketing analytics for decision-making increased their ROI by up to 5-8%.
Improving Sales Alignment
Metrics like MQL (Marketing Qualified Leads) to SQL (Sales Qualified Leads) conversion rate highlight the alignment between marketing and sales teams. A well-aligned strategy can lead to a 67% higher probability of closing deals, as reported by Marketo.
This demonstrates the importance of measuring marketing performance to ensure that both teams are focused on the same objectives and targets.
Enhancing Customer Understanding
KPIs related to customer behavior and preferences, such as engagement rates and customer feedback scores, provide insights into what resonates with the target audience.
Adobe’s Digital Trends Report highlighted that companies with a strong capability in customer analytics are more likely to outperform their competitors, indicating the importance of these metrics in developing effective marketing strategies.
Identifying Market Trends
Analyzing changes in KPIs over time can help businesses identify emerging market trends and adjust their strategies accordingly.
For instance, an increase in website traffic from specific regions might indicate a growing interest in that area, enabling businesses to tailor their marketing efforts to capitalize on this opportunity.
Increasing Customer Retention
Metrics like Customer Lifetime Value (CLV) and Net Promoter Score (NPS) are vital for understanding customer satisfaction and loyalty.
A study by Bain & Company showed that increasing customer retention rates by 5% increases profits by 25% to 95%, emphasizing the importance of measuring and enhancing customer satisfaction and loyalty through marketing efforts.
Driving Revenue Growth
Ultimately, the goal of B2B marketing is to contribute to the bottom line. By measuring metrics such as lead generation rates and conversion rates, businesses can directly correlate marketing activities with revenue growth.
For example, HubSpot reported that companies that excel at lead nurturing generate 50% more sales-ready leads at a 33% lower cost, showcasing the direct impact of effective marketing performance measurement on revenue.
11 Key B2B Marketing Metrics and How to Measure Them
1. Lead Generation Rate
The lead generation rate is a metric that quantifies the effectiveness of your marketing efforts in attracting potential customers. It is essential to understand how well your marketing strategies are generating interest.
How to Measure:
- Track New Leads: Count the number of new leads generated over a specified time frame. This includes leads from all sources - digital ads, social media, email campaigns, etc.
- Calculation: Divide the total number of new leads by the total number of visitors to your marketing channels (e.g., website, landing pages) and multiply by 100 to get the percentage.
Example: If your campaign attracted 1,000 visitors and generated 100 leads, your Lead Generation Rate would be 10%.
2. Conversion Rate
The conversion rate measures the percentage of leads that turn into customers, reflecting the effectiveness of your sales and marketing funnel.
How to Measure:
- Sales Qualified Opportunities (SQOs): Focus on leads that have been identified as ready for the sales team, indicating a higher likelihood of closing.
- Calculation: The conversion rate is the number of SQOs divided by the total number of leads, multiplied by 100.
Example: With 50 SQOs from 200 leads, your Conversion Rate is 25%.
3. Website Traffic
Website traffic measures the total number of visitors to your website. It's a fundamental metric that indicates the reach of your online presence and the initial step in the customer acquisition funnel.
How to Measure:
- Total Visitors: Use tools like Google Analytics and semrush to track the total number of visitors, distinguishing between new and returning visitors.
- Traffic Sources: Analyze the breakdown of traffic sources – organic, direct, referral, or social – to identify which channels drive the most traffic.
Example: If organic search brings in 60% of your traffic, SEO might be a key strength of your marketing.
4. Email Open and Click-Through Rates (CTR)
Email Open Rate measures the percentage of recipients who open a given email.
Click-Through Rate (CTR) measures the proportion of email recipients who clicked on at least one link within an email.
How to Measure:
- Track Email Opens: This measures the percentage of recipients who open your email, reflecting the effectiveness of your subject lines.
- Monitor Click-Through Rates: CTR measures the percentage of email recipients who clicked on one or more links contained in an email, indicating the effectiveness of email content and calls to action.
Example: If 200 out of 1,000 recipients opened your email, your open rate is 20%. If 50 of those 200 clicked a link, your CTR is 25%.
5. Social Media Engagement
Social media engagement measures the interactions users have with your social media content, including likes, shares, comments, and direct messages.
It reflects the effectiveness of your social media strategy in creating conversations and building relationships.
How to Measure:
- Engagement Metrics: Track likes, shares, comments, and follows to gauge audience interaction and interest.
- Engagement Rate Calculation: Divide the total engagement by the number of impressions, then multiply by 100 to get the engagement rate.
Example: If a post receives 100 engagements from 1,000 impressions, the engagement rate is 10%.
6. Content Engagement
Content engagement measures how audiences interact with your content, such as blog posts, whitepapers, and videos.
High engagement rates indicate that your content resonates well with your target audience.
How to Measure:
- Page Views and Time on Page: These metrics indicate the popularity and depth of engagement with your content.
- Bounce Rate: The percentage of visitors who navigate away from the site after viewing only one page, providing insight into content relevance.
Example: High page views and time on page, combined with a low bounce rate, signify engaging and relevant content.
7. Lead Source Effectiveness
Lead source effectiveness measures the performance of various lead generation sources in contributing to your sales funnel. It identifies which channels are most efficient at attracting high-quality leads that convert into customers.
How to Measure:
- Track Leads by Source: Categorize leads based on their origin—be it social media, email marketing, webinars, etc.
- Analyze Conversion Rates: Assess which sources are not just generating the most leads, but also the highest quality leads, by looking at conversion rates from lead to customer.
Example: If leads from webinars have a higher conversion rate compared to other sources, it indicates high effectiveness of webinars as a lead source.
8. Sales Cycle Length
The sales cycle length is the amount of time it takes for a lead to move through your sales funnel and become a customer. This metric is crucial for understanding the efficiency of your sales process.
How to Measure:
- Calculate Average Sales Cycle Length: Track the time from initial contact (lead generation) to sale closure across deals and calculate the average.
- Segment by Product or Service: Different offerings may have inherently different sales cycles. Segmenting can provide more nuanced insights.
Example: If the average sales cycle length for a particular service is 90 days, efforts to reduce this duration could significantly impact revenue and growth.
9. Customer Lifetime Value (CLV)
Customer Lifetime Value represents the total revenue a business can expect from a single customer account throughout their relationship. CLV is a pivotal metric for understanding the long-term value of customers and guiding strategic decisions related to sales, marketing, and customer service.
How to Measure:
- Calculate Average Purchase Value: Assess the average purchase value and frequency over a customer’s relationship.
- Estimate Lifespan: Determine the average customer lifespan and calculate CLV by multiplying the average purchase value, purchase frequency, and lifespan.
Example: If a customer spends an average of $1,000 per year, purchases twice a year, and remains a customer for 5 years, the CLV is $10,000.
10. Return on Marketing Investment (ROMI)
ROMI quantifies the profitability and effectiveness of marketing investments.
By measuring the return on marketing spend, businesses can make informed decisions about budget allocation and strategy optimization to maximize financial outcomes.
How to Measure:
- Calculate Net Profit from Marketing Efforts: Subtract the marketing investment from the gross profit generated by the marketing efforts.
- Determine ROMI: Divide the net profit by the marketing investment and multiply by 100 to get the percentage. This figure represents your return on marketing investment.
Example: If your marketing campaign generated a gross profit of $50,000 with an investment of $10,000, your net profit is $40,000. The ROMI would be 400%, indicating a high return on your marketing spend.
11. Organic Search Ranking
Organic search ranking is a critical metric for B2B companies as it influences website traffic, lead generation, and brand visibility.
High rankings on search engines for targeted keywords indicate effective SEO strategies and content relevance, driving organic discovery and engagement.
How to Measure:
- Track Keyword Rankings: Use SEO tools like Google Search Console, Ahrefs, or SEMrush to monitor the rankings of your website’s keywords on search engines.
- Analyze Changes in Rankings: Pay attention to shifts in rankings and how they correlate with changes in website traffic and lead generation. This will help identify which keywords and content strategies are most effective.
Example: If your website moves from page two to the top three search results for a high-value keyword, you can expect a significant increase in organic traffic, which can lead to more leads and customers.
11 Key B2B Marketing KPIs and How to Measure Them
1. Marketing Qualified Leads (MQLs)
MQLs are potential customers who have demonstrated interest in your product or service through marketing activities and are considered more likely to convert into customers compared to other leads.
How to Measure:
- Track Engagement: Utilize marketing automation and CRM tools to monitor interactions such as website visits, content downloads, and webinar attendance.
- Set Criteria: Define specific criteria that classify a lead as an MQL, such as scoring leads based on their actions or engagement level.
Example: A lead that downloads a whitepaper and attends a product demo webinar can be considered an MQL based on predetermined criteria.
2. Sales Qualified Leads (SQLs)
SQLs are leads that have been evaluated by the sales team and deemed ready for direct sales follow-up, indicating a higher intent to purchase.
How to Measure:
- Sales Team Review: After marketing identifies an MQL, the sales team further assesses the lead's readiness to buy, looking at specific behaviors or expressed needs.
- Define Transition Criteria: Establish clear guidelines for when an MQL becomes an SQL, such as a scheduled consultation call or a completed needs-assessment form.
Example: An MQL that requests a pricing quote and has a detailed discussion about product features with a sales rep is upgraded to an SQL.
3. Lead Conversion Rate
The Lead Conversion Rate measures the efficiency of turning leads into paying customers, crucial for understanding the effectiveness of the sales process and marketing efforts.
How to Measure:
- Calculate Conversion Rate: Divide the number of new customers acquired by the total number of SQLs over a specific period, then multiply by 100 to get a percentage.
- Continuous Monitoring: Use CRM software to track conversions and analyze trends over time to identify opportunities for improvement in the sales funnel.
Example: If 50 new customers were acquired from 200 SQLs in a month, the Lead Conversion Rate would be 25%.
4. Cost Per Lead (CPL)
CPL measures the cost-effectiveness of marketing campaigns in generating new leads. Keeping the CPL within optimal limits ensures that marketing efforts are economically sustainable.
How to Measure:
- Calculate Total Campaign Costs: Sum up all expenses associated with a particular marketing campaign or channel.
- Divide by Number of Leads Generated: The total campaign cost divided by the total number of leads generated gives the CPL.
Example: If a campaign costing $2,000 generates 100 leads, the CPL is $20.
5. Customer Acquisition Cost (CAC)
CAC quantifies the total average cost spent on acquiring a new customer. It's critical for understanding the investment needed to expand the customer base and for evaluating the scalability of marketing strategies.
How to Measure:
- Sum Total Acquisition Costs: This includes all marketing and sales expenses over a specific period.
- Divide by Number of New Customers Acquired: The total acquisition costs divided by the number of new customers within that period yields the CAC.
Example: If the total expenses are $10,000 and 50 new customers were acquired, the CAC is $200 per customer.
6. Customer Lifetime Value (CLV) to CAC Ratio
The CLV to CAC Ratio is a critical metric for assessing the long-term value of acquiring new customers relative to the cost of acquisition. A healthy ratio indicates that the value derived from a customer significantly exceeds the cost to acquire them.
How to Measure:
- Determine CLV: Calculate the expected average revenue that a customer will generate throughout their relationship with the company.
- Calculate the Ratio: Divide the CLV by the CAC to determine the ratio.
Example: If the CLV is $2,000 and the CAC is $200, the CLV to CAC Ratio is 10:1.
7. Account Engagement Score
This KPI measures the engagement level of each account or target company with your marketing efforts, crucial for Account-Based Marketing (ABM) strategies. It helps prioritize resources and tailor communications to enhance engagement and conversion rates.
How to Measure:
- Aggregate Engagement Data: Collect data on various engagement metrics such as email opens, website visits, content downloads, and event participation specific to each account.
- Scoring Model: Develop a scoring model that assigns points based on the depth and frequency of engagement. Sum these points to compute the overall Account Engagement Score.
Example: An account regularly interacting with emails and attending webinars might score higher, indicating a higher level of interest and potential for conversion.
8. Pipeline Contribution
Understanding the portion of the sales pipeline generated by marketing efforts (marketing teams, lead generation, content marketing) highlights the effectiveness of these efforts in driving potential sales and revenue.
How to Measure:
- Track Origin of Opportunities: Identify which sales opportunities originated from marketing efforts.
- Calculate Contribution: Divide the total value of these opportunities by the overall value of the sales pipeline to determine the percentage contribution.
Example: If marketing-generated opportunities account for $500,000 of a $2 million sales pipeline, the Pipeline Contribution is 25%.
9. Marketing ROI
Marketing ROI assesses the return on investment from marketing activities, comparing the gain from these investments against their cost. It's vital for evaluating the financial efficiency and effectiveness of marketing strategies.
How to Measure:
- Determine Gains from Investment: Calculate the incremental revenue attributed to marketing efforts.
- Subtract Investment Cost: Deduct the total cost of marketing activities from the gains.
- Calculate ROI: Divide the net gain by the cost of investment and multiply by 100 to express as a percentage.
Example: If marketing efforts result in $100,000 in revenue from a $40,000 investment, the Marketing ROI is 150%.
10. Net Promoter Score (NPS)
NPS is a widely recognized metric for measuring customer satisfaction and loyalty. It indicates how likely customers are to recommend your product or service to others, serving as a predictor of business growth and customer retention.
How to Measure:
- Conduct Surveys: Request customers to indicate, on a scale from 0 to 10, their likelihood of recommending your product or service.
- Categorize Responses: Classify respondents as Promoters (9-10), Passives (7-8), or Detractors (0-6).
- Calculate NPS: Subtract the percentage of Detractors from the percentage of Promoters. NPS can range from -100 (all Detractors) to 100 (all Promoters).
Example: If 50% of respondents are Promoters and 10% are Detractors, your NPS is 40.
11. Churn Rate
The Churn Rate measures the percentage of customers who end their relationship with a company within a certain period. It's crucial for understanding customer retention, identifying potential issues with product or service satisfaction, and evaluating the effectiveness of customer service and support efforts.
How to Measure:
- Track Customer Loss: Count the number of customers who have left or canceled their service over a set period.
- Divide by Total Customers: Divide the number of lost customers by the total number of customers at the start of the period, then multiply by 100 to get the churn rate percentage.
Example: If you start the quarter with 200 customers and lose 10, your Churn Rate is 5%.
How to Make Informed Decisions Using Marketing Metrics and KPIs
Making informed decisions using marketing metrics and KPIs requires a strategic approach to data analysis and application. By effectively leveraging these insights, businesses can optimize their marketing efforts and plan their new marketing initiatives for better results.
Here's how to use marketing metrics and KPIs to guide decision-making:
Understand Your Objectives
- Begin by clearly defining your marketing campaign objectives. Whether it's increasing brand awareness, generating leads, or boosting sales, your goals will determine which metrics and KPIs are most relevant.
- For instance, if your goal is to enhance lead quality, focus on marketing qualified leads (MQLs) and sales qualified leads (SQLs) as key indicators.
Collect and Analyze Data
- Utilize tools and platforms that offer detailed analytics, such as Google Analytics for website traffic and engagement, CRM systems for customer acquisition cost (CAC) and customer lifetime value (CLV), and email marketing software for open and click-through rates.
- Analyze trends over time, not just snapshots. A steady increase in conversion rates or a decrease in CAC indicates successful marketing strategies.
Prioritize Based on Impact
- Focus on metrics and KPIs with the highest impact on your objectives. If increasing customer retention is a priority, churn rate and customer satisfaction metrics like Net Promoter Score (NPS) should be at the forefront of your analysis.
- Compare your performance against industry benchmarks to understand where you stand and identify areas for improvement.
Implement Data-Driven Strategies
- Use insights from your data to inform your marketing strategies. For example, if analysis shows high engagement rates from social media but low conversion rates from email marketing, reallocating resources to enhance your social media presence could be beneficial.
- Test different approaches to see what works best. A/B testing can be particularly effective in refining email marketing campaigns or landing page designs.
Measure and Adjust:
- Continuously monitor the performance of your adjusted strategies through your chosen metrics and KPIs. This allows for real-time adjustments and ensures your marketing efforts remain aligned with your objectives.
- For example, if the goal was to reduce CAC and you implemented a new digital marketing strategy, track this metric closely to gauge the strategy's effectiveness.
Marketing Metrics and KPIs for Achieving Business Objectives
Tools and Techniques for Tracking B2B Marketing KPIs
Here’s a guide to some of the most effective tools and techniques for monitoring B2B marketing KPIs:
Analytics and Data Management Tools
1. Google Analytics

Essential for tracking website traffic, user behavior, and conversion metrics. It provides insights into how visitors interact with your site and the effectiveness of your content marketing efforts.
2. CRM Systems
Platforms like Salesforce or HubSpot are crucial for tracking sales qualified leads (SQLs), customer acquisition cost (CAC), and customer lifetime value (CLV). They offer a comprehensive view of customer interactions and the sales pipeline.
3. Marketing Automation Software
Tools such as Marketo and Pardot enable the tracking of email marketing metrics, lead generation activities, and marketing qualified leads (MQLs). They automate repetitive tasks and provide valuable data on campaign performance.
Social Media and Content Analytics
4. Social Media Monitoring Tools
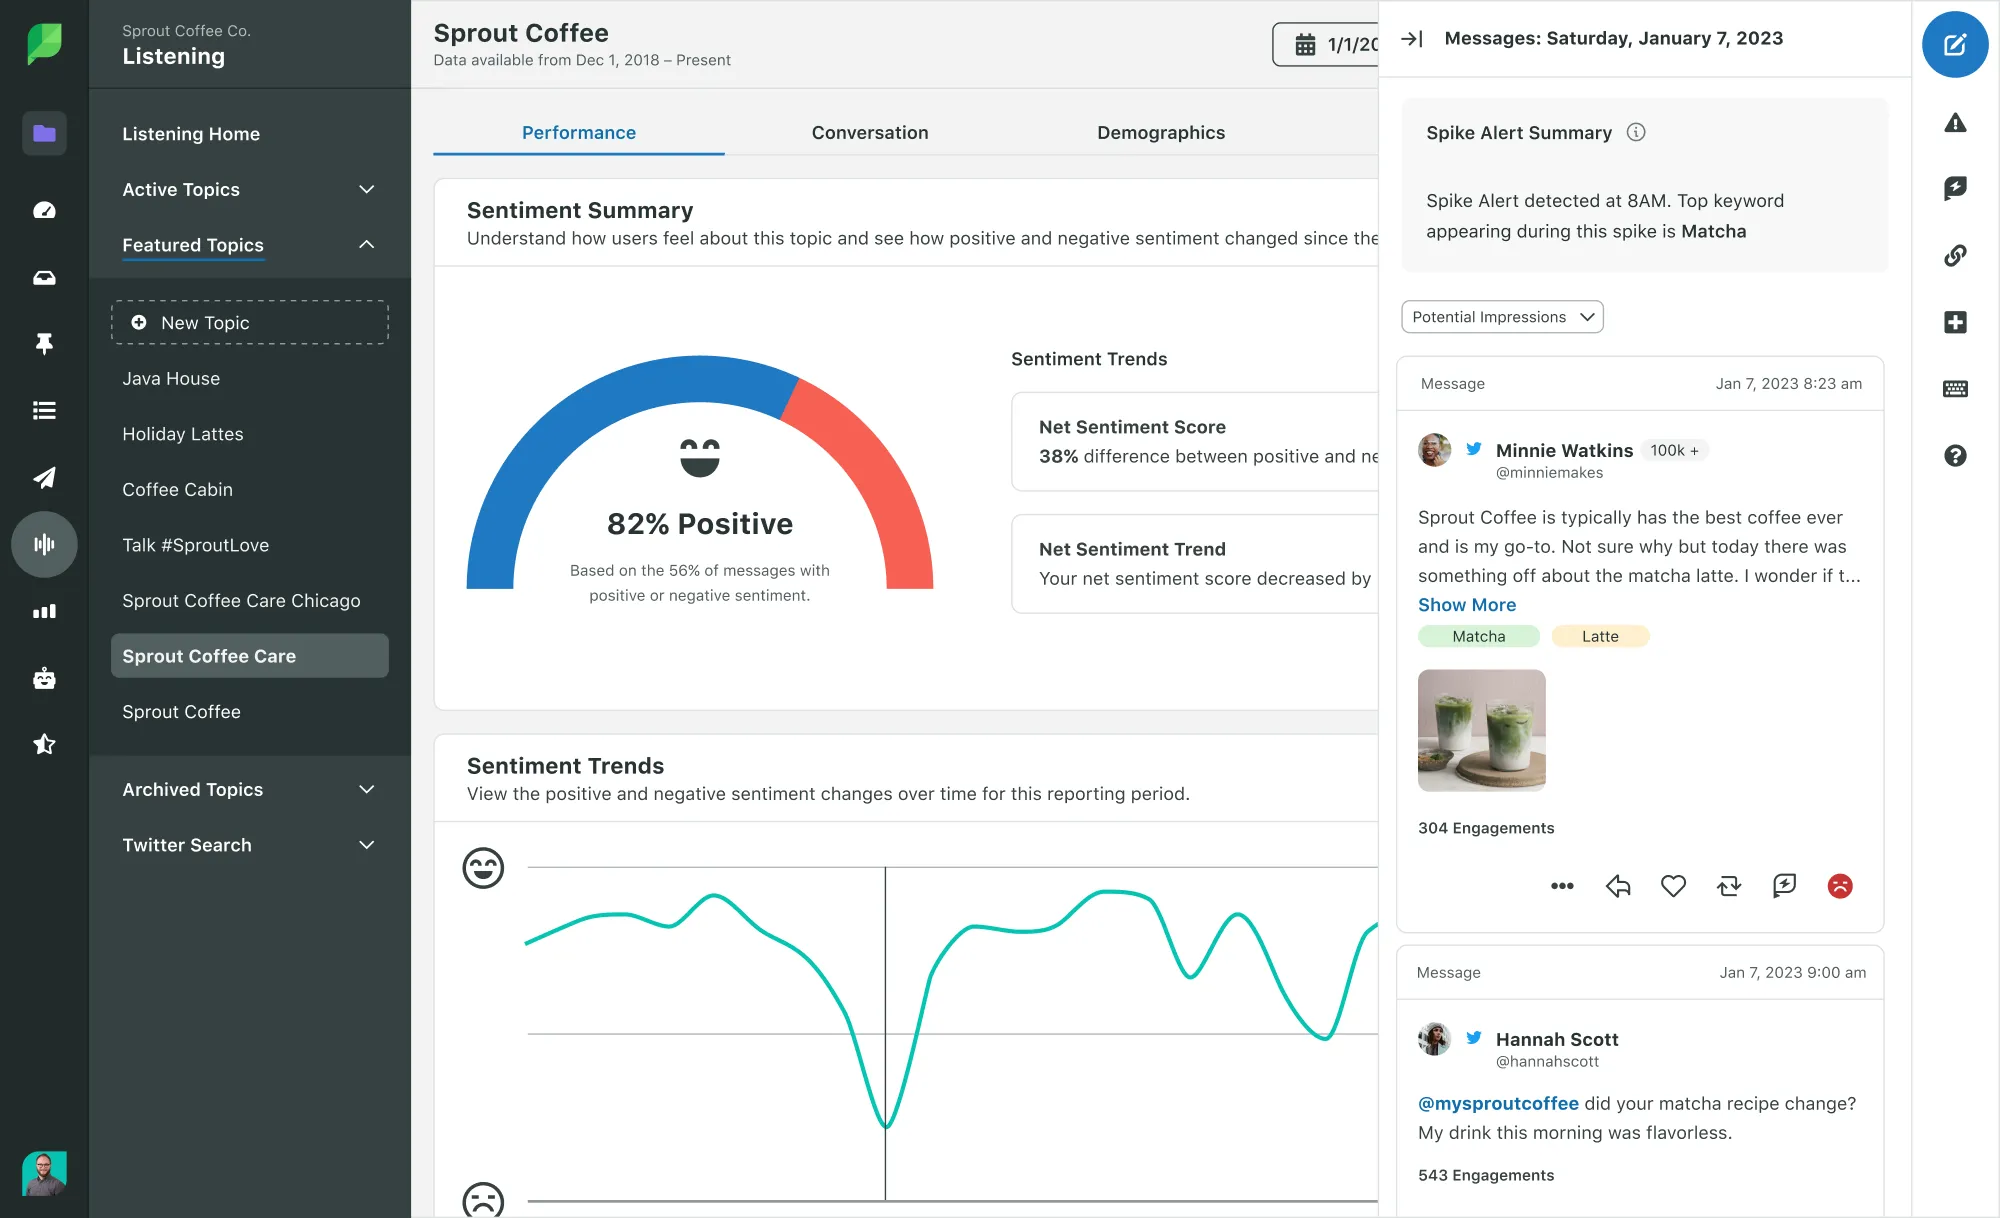
Platforms like Hootsuite and Sprout Social offer insights into social media engagement, allowing marketers to track how social content contributes to marketing KPIs like lead generation and brand awareness.
5. Content Analytics Tools
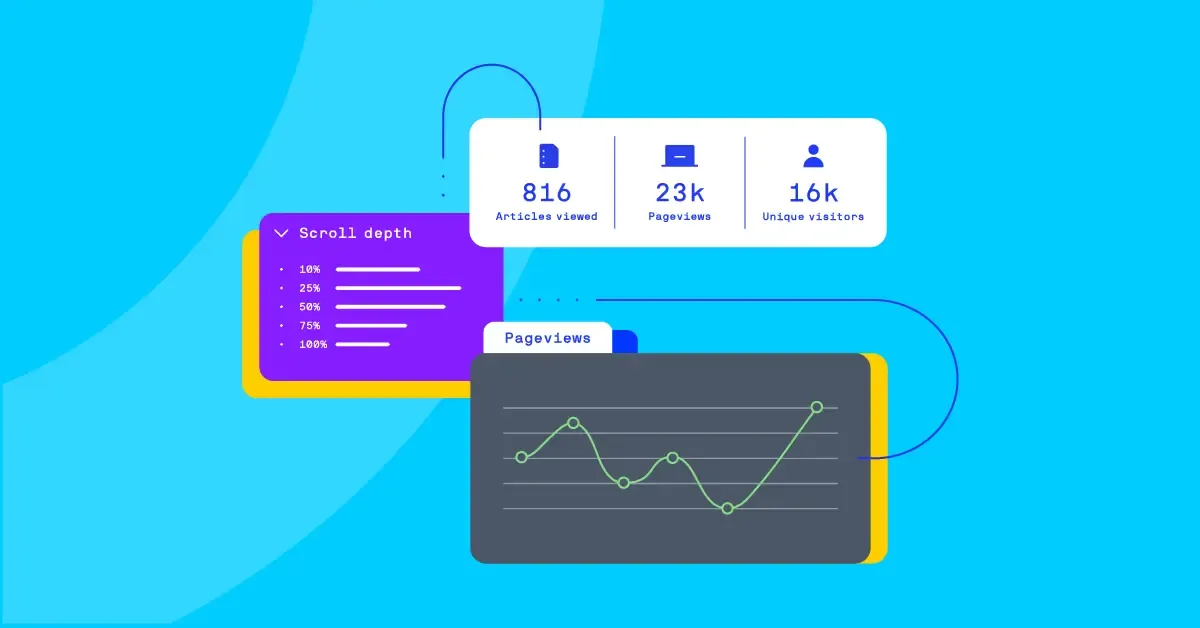
Solutions such as BuzzSumo and Google Search Console help in understanding content performance, keyword rankings, and backlink profiles, crucial for SEO strategies and content marketing.
Performance and Conversion Tracking
6. Heat Mapping Tools

Tools like Hotjar and Crazy Egg provide visual representations of where visitors click, move, and scroll on your website, offering insights into user engagement and potential areas for optimization.
7. A/B Testing Platforms
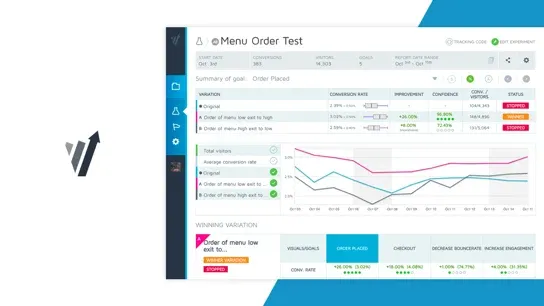
Optimizely and Unbounce allow marketers to test different versions of web pages to see which performs better in terms of conversion rate optimization, a key factor in improving sales funnel efficiency.
Techniques for Effective KPI Tracking
8. Segmentation and Cohort Analysis

Breaking down data into specific segments or cohorts for analysis can help identify patterns and trends related to specific customer groups or marketing channels, enhancing the understanding of KPI performance.
9. Predictive Analytics

Leveraging machine learning algorithms and statistical techniques sales team and marketing team can predict future outcomes based on historical data. This can be particularly useful for forecasting sales trends and assessing the potential impact of marketing strategies on revenue.
10. Dashboard and Reporting Tools
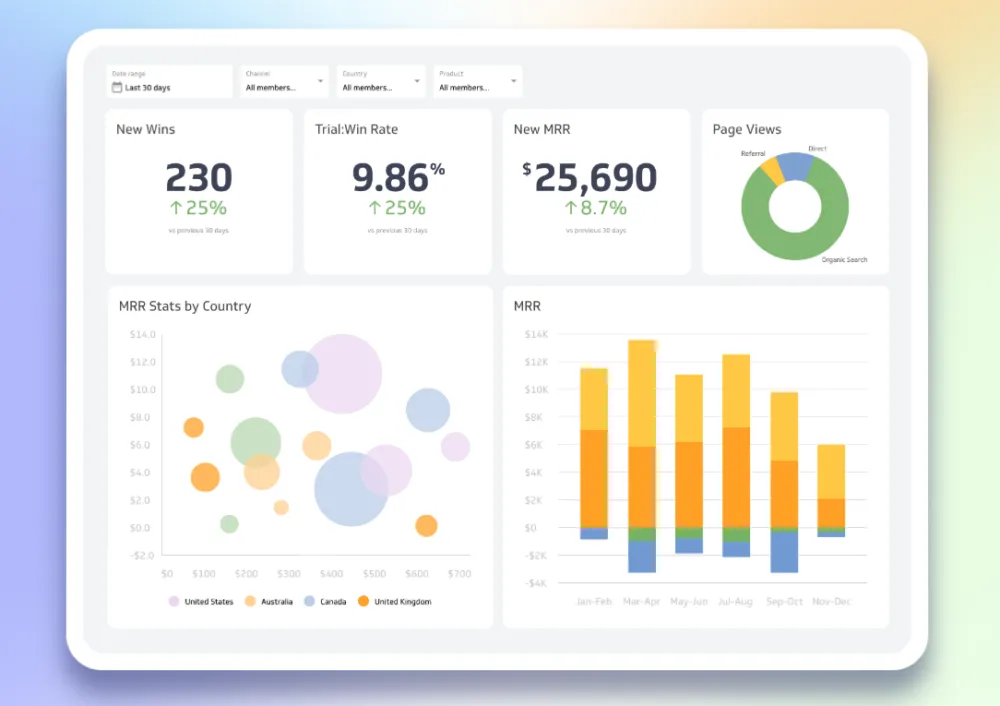
Implementing dashboards through tools like Tableau or Google Data Studio can consolidate data from multiple sources into a single, visually appealing report, making it easier to monitor KPIs and share insights across teams.
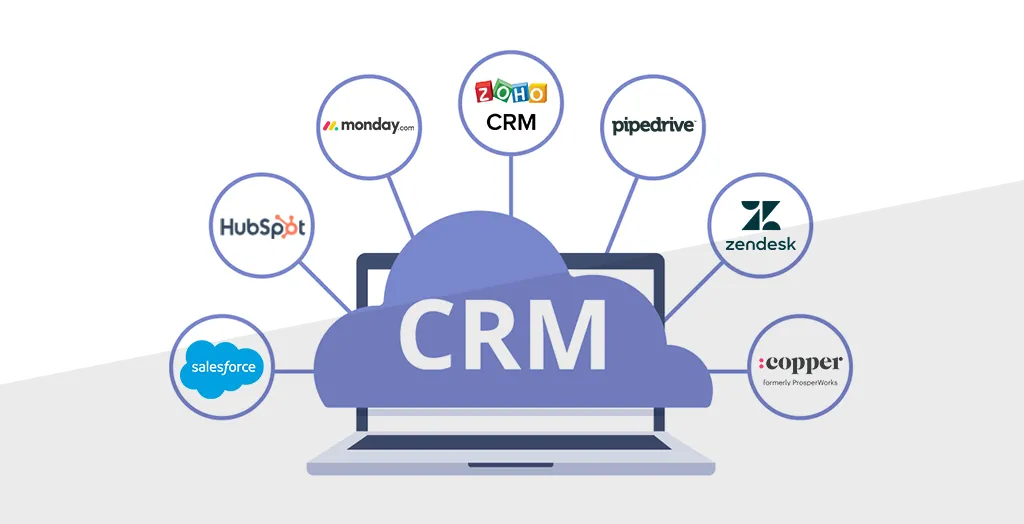
How to Automate Your Marketing Efforts With a CRM
Automating your marketing efforts with a Customer Relationship Management (CRM) system can dramatically streamline your processes, enhance customer engagement, and increase sales efficiency.
A CRM system centralizes customer data, automates marketing tasks, and provides insights into customer behavior
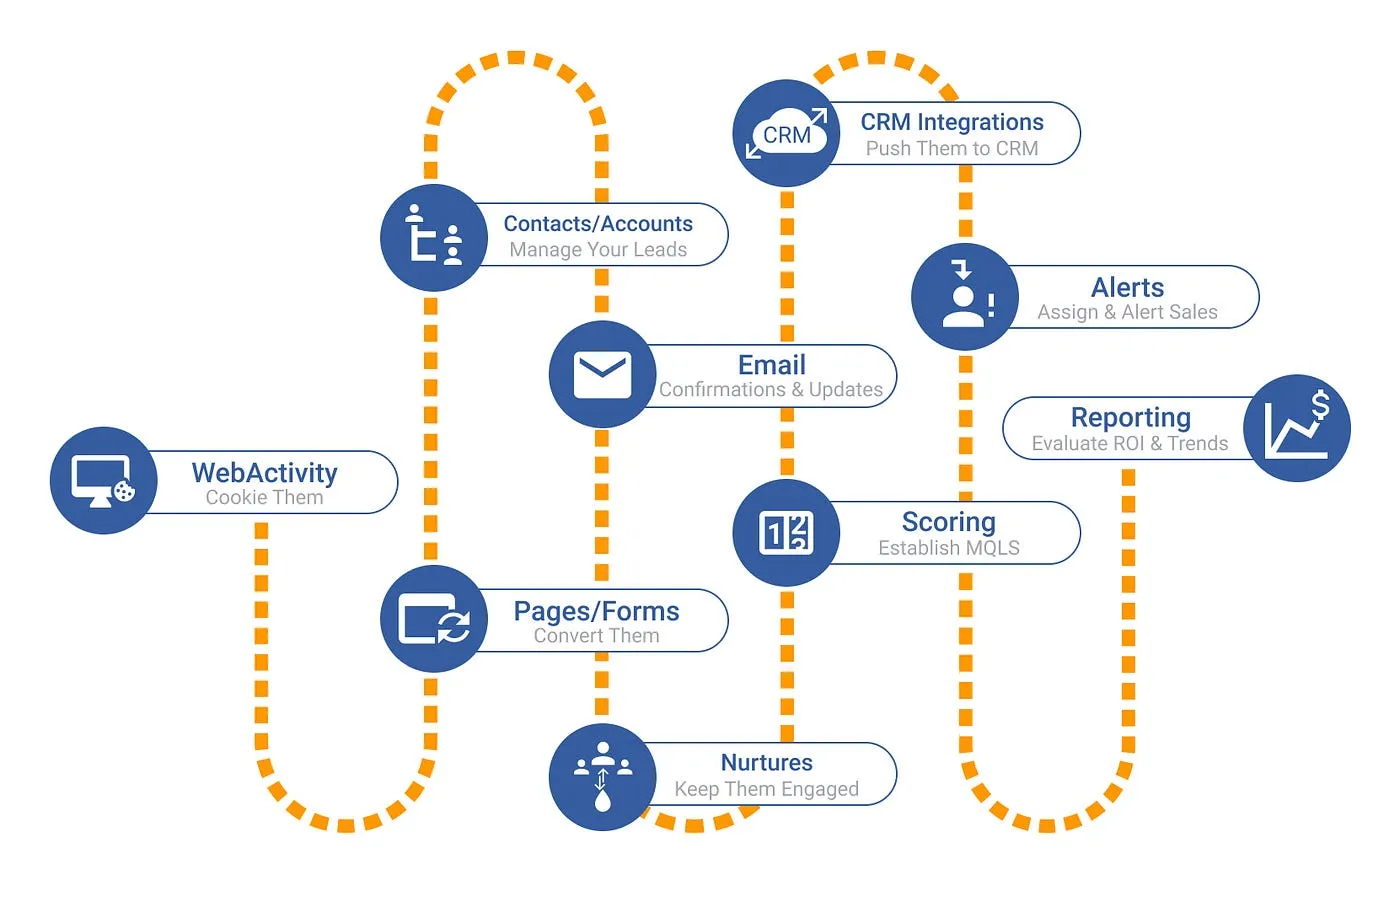
Lead Generation and Nurturing
Automated Lead Capture: CRMs can automatically capture leads from various sources like website forms, social media, and email, ensuring no potential customer slips through the cracks. This automation reduces manual data entry and the chance of errors.
- Automating lead capture can increase lead volume by up to 30%, according to Marketo, by promptly and efficiently capturing interest.
Lead Scoring and Segmentation: Use your CRM to score leads based on their actions and demographic information. This helps in prioritizing the leads that are most likely to convert.
- Set up scoring criteria based on website visits, email engagement, and product interest. Segment leads into categories for personalized follow-up campaigns.
Email Marketing Automation
Personalized Email Campaigns: CRMs allow for the creation of personalized email campaigns based on customer data and interactions, which can lead to higher open and conversion rates.
- Campaign Monitor reports that personalized email messages improve click-through rates by an average of 14% and conversions by 10%.
Automated Follow-ups: Schedule automated follow-up emails for customers who have taken specific actions, like downloading a white paper or abandoning a shopping cart.
- Automated follow-ups can help recover up to 20% of abandoned cart sales, as per Moosend research.
Customer Segmentation and Targeting
Dynamic Segmentation: Automatically segment customers based on behavior, purchase history, and preferences to tailor marketing strategies effectively.
- Segmented campaigns have been shown to drive a 760% increase in revenue, according to a report by Campaign Monitor.
Targeted Campaigns: Use these segments to launch targeted marketing campaigns. Tailored messaging resonates more with customers, leading to higher engagement and conversion rates.
- Develop specific offers for different segments. For example, offer first-time buyer discounts or loyalty rewards for repeat customers.
Reporting and Analytics
Real-time Analytics: CRM systems provide real-time analytics on marketing campaign performance, customer behavior, and sales trends. This enables timely adjustments to strategies for better results.
- Real-time data can help identify underperforming campaigns quickly, potentially saving thousands in wasted ad spend.
ROI Measurement: Easily measure the return on investment for each marketing channel and campaign, helping to allocate resources more effectively.
- Set up custom dashboards in your CRM to track key performance indicators like cost per lead, conversion rate, and customer acquisition cost, to calculate how much revenue will be generated.
Final Thoughts on Measuring Marketing Efforts
Measuring the right metrics and KPIs is essential for any B2B business. Understanding things like how many new leads you're getting, how many of those leads turn into customers, and how much traffic your website sees can tell you a lot about how well your marketing is working. It's important to know the difference between general metrics and key performance indicators (KPIs), as KPIs are the main stats you'll use to make big decisions.
Using tools like CRM systems helps collect this data and gives you insights on what your customers are doing and what they want. Metrics like the cost to get a new customer (CAC) and how much value they bring (CLV) help you see if you're spending your marketing budget wisely.
Also, strategies like breaking down your data into smaller groups or using software to predict future trends can make your marketing even better. Automating your marketing, like sending emails automatically, can save you time and make your efforts more effective.
In short, knowing and using these metrics and KPIs can help your business grow by making smarter decisions, spending your budget better, and understanding your customers more deeply. As the business world changes, keeping up with these measurements will keep you ahead of the game.