If your sales team still runs on guesswork, spreadsheets, or "just winging it," you're leaving serious money on the table. A flow chart of sales process helps fix that—fast. It gives your team a clear path from lead to close.
And here’s the kicker: businesses with a well-defined sales process see 18% more revenue growth, according to Harvard Business Review. Ready to simplify your pipeline and actually close more deals?
Let’s break it down—visually, step by step.
What Is a Flow Chart of Sales Process?

A flow chart of sales process is a simple visual that shows each step your sales team follows to turn leads into paying customers. A sales process refers to the full journey a lead takes—from first contact to close. It’s like a roadmap—only cleaner and easier to follow.
This visual guide is also known as a sales process map. A sales process map serves as a detailed flowchart that helps teams visualize each stage of the sales workflow, making onboarding easier and helping to spot inefficiencies in the process.
Instead of guessing who does what, a flowchart shows you exactly where to start, how to move a lead forward, and when to close the deal.
You can use boxes, arrows, and labels to break the process into simple actions like:
- Lead generation → Finding people who may want to buy
- Lead qualification → Checking if they’re a good fit
- Initial contact → Calling, emailing, or meeting the lead
- Proposal creation → Sending a formal offer
- Follow up → Checking in if they don’t reply
- Closing deals → Getting a “yes” and finalizing the sale
“According to Harvard Business Review, companies with a clearly defined sales process experience up to 28% greater revenue growth than those without one.”
Why Sales Teams Need a Flowchart Today
A messy or unclear sales process costs you time and leads. That’s where the flowchart comes in—it keeps your sales team members focused and organized. Here’s why it matters:
- Fewer missed steps – Everyone knows what to do next
- Better communication – Helps align the sales and marketing teams
- More consistent results – Standardizes how qualified leads are handled
- Easier onboarding – New reps can follow the flow from day one
- Improved tracking – Managers can spot weak points in the sales cycle, and measure and optimize your team's efforts throughout the sales process.
By showing your current sales process visually, you can spot gaps and build a more effective sales process
What Makes an Effective Sales Process Today?

An effective sales process is clear, simple, and repeatable. It guides your sales team from lead generation to closing deals without confusion. Defining buyer personas is crucial to ensure the sales process is tailored to the right audience and addresses their specific needs.
A strong process uses a flow chart of sales process to show steps like lead qualification, initial contact, follow up, gather feedback, and iterate.
Flow Chart of Sales Process vs Sales Process Diagram vs Sales Pipeline
Benefits of Using a Sales Flowchart

A sales flowchart helps visualize each step of your sales process, making it easier for your team to understand and follow. It streamlines communication, reduces errors, and ensures everyone is on the same page.
Additionally, a flowchart can serve as a visual component of your sales playbooks, helping teams follow best practices and standardized steps.
1. Keeps Sales Team Members on the Same Page
Different sales reps may follow different routines, causing confusion and missed steps.
How a flowchart helps:
- A good sales process flowchart helps teams avoid confusion and stay on track.
- Shows every step of the entire sales process clearly
- Makes sure sales team members know their exact role
- Helps new hires learn faster by following a set flow
- Aligns the sales organization, especially when many people are involved
Real-life scenario: If one rep skips lead qualification or another forgets to follow up, the team loses deals. A shared flowchart prevents that.
2. Improves Lead Handling and Follow-Up Timing
Without structure, leads fall through the cracks. Some get called too late. Others never get a second touch.
How a flowchart helps:
- Adds timing triggers for when to call, email, or send a proposal
- Shows when to do a follow up after the initial contact
- Supports smoother transitions from marketing team to sales team
Bonus tip: You can add automation based on the chart to improve your team’s sales efforts. Lead nurturing can also be automated and improved using the flowchart, ensuring prospects are engaged at every stage and qualified leads are not lost.
Spot and Convert More Qualified Leads with Clarity
Many teams waste time on the wrong people. Not every lead is ready to buy.
How a flowchart helps:
- Adds filters for qualified leads early in the process
- Makes lead qualification part of the standard steps
- Reduces time wasted chasing prospective customers who aren’t a fit
Why it matters: Clear steps help you focus on leads that match your product, speeding up the sales journey and increasing your sales performance.
3. Boosts Sales Manager Oversight and Coaching
A flow chart of sales process makes it easier for sales managers to see what’s really happening in the day-to-day. They don’t need to ask, “Where’s the deal stuck?” The visual shows it.
How it helps:
- Tracks what each sales rep is doing
- Makes team performance measurable and visible
- Helps managers give better feedback at the right time
- Spot which reps are skipping steps like lead qualification or proposal creation
Real example: Let’s say your team has trouble with initial contact. A flowchart shows if reps delay or forget it altogether. The manager steps in, coaches on better follow-up, and improves conversion.
4. Identifies Bottlenecks in the Sales Cycle
A bottleneck is a point where things get stuck. It slows down the sales cycle and frustrates both reps and potential customers.
How a flowchart helps:
- Shows delays between steps—like slow follow up
- Flags stages where deals go cold
- Helps reduce waste in your sales efforts
- Reveals which sales process steps are too complex or unclear
Real example: Your reps might be spending too long after a qualified lead is passed to them. The flowchart shows the lag and helps you fix it—fast.
Bonus tip: Adding timestamps or KPIs like key performance metrics to each stage can make your flowchart even more useful.
5. Supports Better Resource Allocation
Resource allocation is about using your team’s time, tools, and energy in the smartest way possible. A flow chart of sales process helps you do that.
How it helps you:
- Shows exactly which sales team members are involved at each stage
- Makes it clear where your sales reps spend most of their time
- Helps sales managers decide where to add support or tools
- Identifies tasks that can be automated or simplified
- Aligns tasks between your marketing team and sales organization
Real-world scenario: Let’s say your reps are spending too much time in the prospecting stage. The chart reveals the issue. You might hire a junior rep or shift efforts to inbound leads.
“Businesses that optimize resource allocation improve productivity by 20% or more, according to McKinsey.”
6. Strengthens the Customer Experience
Customers notice when your process is messy. Missed emails, late replies, and unclear steps cause frustration. A visual flow helps avoid that.
How a flowchart improves it:
- Makes the customer journey more predictable
- Ensures timely follow up and initial contact
- Keeps your sales reps from skipping important touchpoints
- Improves speed from lead generation to closing deals
- Helps your team understand and fix pain points in the process
Real example: Imagine a potential customer fills out a form. No one follows up for 3 days. That lead goes cold. With a flowchart, everyone knows what to do—and when.
A clean, consistent flow makes it easier for your team to guide qualified leads toward becoming a paying customer—with less friction and more satisfaction.
7. Make Closing Deals a Consistent Outcome
A flow chart of sales process helps you close more deals—consistently. Everyone—from sales reps to sales managers—knows their role. That means fewer mistakes, faster movement, and smoother follow up.
When teams follow a defined sales process, they can track what works and fix what doesn’t. A flowchart turns your sales efforts into a system. No more "winging it." You’ll see where prospects drop off, what slows down progress, and how to improve conversion rates.
When used right, your sales flowchart becomes a playbook for turning a maybe into a “yes.” That’s how you build a solid sales process—one that brings in qualified leads and turns them into paying customers, again and again.
Step-by-Step Guide: How to Build a Sales Process Flowchart

Creating a flow chart of sales process is like drawing a clear roadmap for your sales team. It helps everyone—from new hires to seasoned sales reps—understand what to do at each step. Let’s break it down so it’s easy to follow and apply.
1. Start by Outlining Your Entire Sales Process
Before building anything, list every step in your entire sales process—from lead generation to closing deals. You need to know what happens, when it happens, and who’s responsible.
Ask your sales managers and sales reps questions like:
- How do you find qualified leads?
- When do you make initial contact?
- What steps do you take before sending a proposal?
"Teams with a clear sales process are 33% more likely to close deals successfully.” – Harvard Business Review
Checklist for this step:
- Write down each phase: prospecting stage, qualification, proposal, negotiation, and final sale.
- Include side steps like follow-up calls or product demos.
- Use arrows or boxes to show direction. Keep it visual and simple.
Audit Your Current Sales Process Before You Map It
Don’t just guess—review your current sales process. Talk to the sales organization. Check your CRM data. Look at where deals get stuck.
Ask:
- Are sales activities happening too late?
- Are potential customers dropping off at the proposal stage?
This audit lets you spot gaps before building the final sales process diagram.
2. Define Roles for Sales Reps and Teams
Every part of your sales process flowchart should show who owns what. That means assigning tasks clearly between sales team and marketing team.
Tips to define roles:
- The marketing team can handle generating leads and warming up prospects.
- Sales reps focus on the decision makers and handle objections.
- Let account managers manage the post-sale phase and loyal customers.
- Make sure your flowchart shows what actions the sales team takes at each stage.
When you define roles, you're not just making a pretty chart. You're reducing confusion and helping your sales efforts run smoothly.
“A defined sales process boosts conversion rates by 18% and shortens the sales cycle by 12%.” – Salesforce State of Sales Report 2024
3. Use Sales Process Mapping Tools (No Design Skills Needed)

You don’t need to be a designer to build a flow chart of sales process. The right tools do most of the work for you. Sales process mapping tools help you show each part of the sales process in a visual way.
Here’s what they do:
- Let you drag and drop steps in your sales cycle.
- Make it easy to update when your sales strategy changes.
- Help sales reps and sales managers stay aligned.
Pro Tip: Start with a typical sales process template. Edit it to match your team’s sales methodology and sales activities. Don’t worry if your first version isn’t perfect. You can improve it as your sales organization grows.
“Teams that use visual sales process mapping tools see a 15% boost in clarity and task ownership.” — HubSpot Report, 2024
4. Visualize the Customer Journey Clearly
Align Your Flowchart with the Buyer’s Journey
A sales process flowchart should match your customer’s path. This means showing what the buyer sees, feels, and needs at each stage—from first click to closing deals.
What to Include: Break down the customer journey into simple stages:
- Awareness: They find you (ads, blogs, social posts)
- Interest: They explore your offers
- Decision: They talk to your sales reps, ask questions
- Action: They buy and become a loyal customer
Your flowchart should show what your sales team members do at each step—calls, emails, demos, or proposal creation. It should also highlight where decision makers get involved.
“Companies that map the buyer’s journey are 2X more likely to exceed their sales performance goals,” — HubSpot Sales Report, 2024.
Checklist for a Clear Buyer-Aligned Flowchart:
- Mark each sales process step clearly
- Show triggers like email opens or phone calls
- Add time frames (e.g., follow-up within 2 days)
- Label each team’s role (like account manager or sales rep)
5. Add Decision Points and Lead Qualification Filters
Every flow chart of sales process should clearly show where decisions are made. These decision points help your sales reps know what to do next. Without this, your entire sales process can get stuck or move in the wrong direction.
What are decision points?
These are moments where the sales team must decide what to do based on the prospect’s actions. For example:
- Did the customer open the email?
- Did they attend the demo?
- Are they a good fit?
This is where lead qualification comes in. You don’t want to waste time on the wrong prospects.
Use a filter system: Qualify leads early. Use clear criteria like:
- Budget
- Decision-making power
- Need
- Timeline
“Companies that excel at lead qualification see 9.3% higher conversion rates” – CSO Insights, 2024
Ask early questions to uncover the prospect’s pain points and gain a deep understanding of the prospect's business. This allows you to tailor your pitch and solutions to address their specific challenges and needs.
Highlight Decision Makers Early in the Flow
Also, highlight decision makers at each point. Sales professionals often lose deals because they pitch to the wrong person. Make sure your sales process flowchart shows who the key decision makers are in each stage.
Checklist
- Add Yes/No decision boxes
- Mark when a prospect becomes a qualified lead
- Show what happens if a lead doesn’t meet criteria
- Indicate who the sales rep should contact next
6. Include Timeframes and Triggers
A sales process without timing is like a train without a schedule—it won’t run smoothly. Add clear timeframes and triggers into your flowchart. This helps your sales team follow up on time and move leads faster through the sales cycle.
What are triggers?
They’re actions or events that push the next step forward. For example:
- If no reply after 2 days → send a follow-up
- If demo is completed → schedule proposal creation
- If no decision after 7 days → escalate to sales managers
Including timeframes creates accountability. It also improves performance tracking for your sales team members and boosts sales efficiency across the board.
“Sales reps who follow up within 5 minutes are 9x more likely to convert leads.” – Lead Response Management Study, MIT
How to do it:
- Add time boxes next to each sales activity
- Use icons or labels to show wait times
- Define clear triggers between each step
7. Review, Optimize, and Share It
Once you finish the flow chart of sales process, don’t stop there. A flowchart is only useful if it works in the real world. That’s why reviewing, updating, and sharing it with your sales team is key.
Here’s what to do next:
- Test the entire sales process: Walk through the entire process to make sure no key step is missed. Does it match how your sales reps really work?
- Get input from the marketing team and sales managers. They can spot gaps you might miss.
- Check lead qualification points and decision makers in the chart. Are they still right?
- Use visual representation tools like Lucidchart or Miro to improve clarity.
- Ask if it aligns with your sales strategy and current customer journey.
Then, share it with the whole team. Post it in your CRM or your sales playbook. Everyone—from new hires to account managers—should be on the same page.
Sales Process Mapping Examples You Can Copy
Below are real-world sales process examples that you can copy or adapt.
1. B2B Example: SaaS sales process flowchart

For SaaS companies, the sales process flowchart focuses on solving the prospect’s problem and guiding decision makers through the buyer’s journey.
Here’s how the flow works:
- Lead Generation: Use ads, webinars, or inbound leads.
- Lead Qualification: Check if the company is a good fit.
- Initial Contact: Send a helpful email or make a phone call.
- Demo/Meeting: Show how your product solves their pain points.
- Proposal Creation: Build a clear offer with pricing and features.
- Follow Up: Remind them and answer questions.
- Closing Deals: Sign the contract and onboard.
Pro Tip: “SaaS teams that follow a defined sales process close 33% more deals.” — HubSpot Research
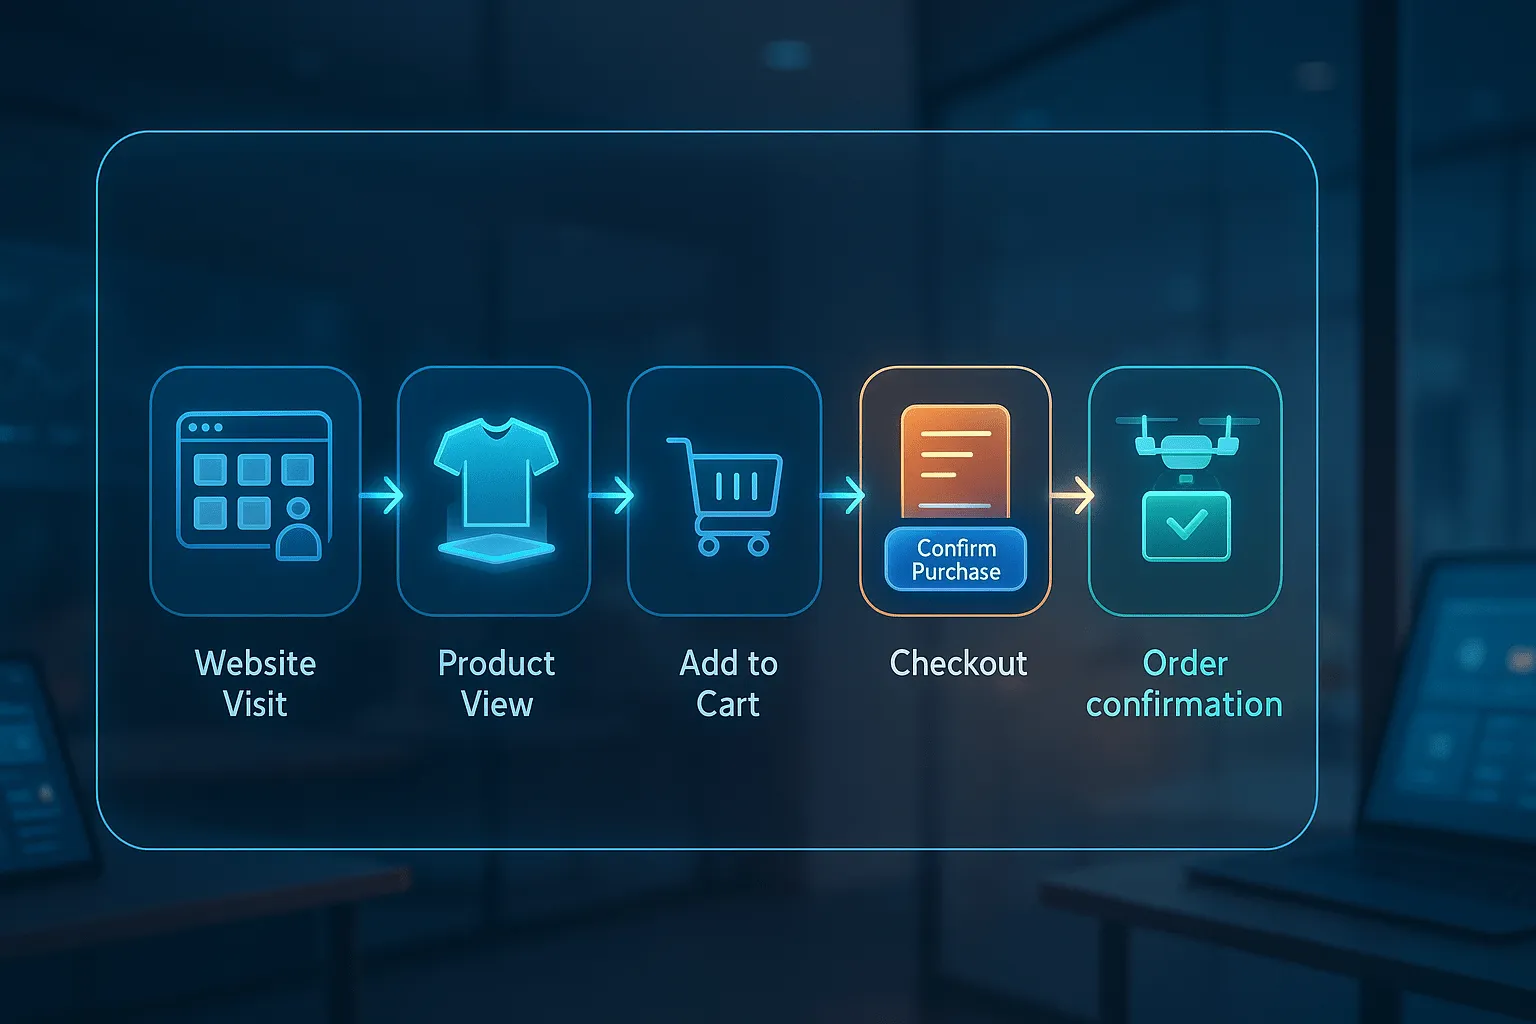
2. B2C Example: Simple sales process for eCommerce

For eCommerce, you need a simple sales process that is fast and easy.
Your steps may look like this:
- Attract Traffic: Use SEO or social ads.
- Product Page Visit: Clear product info and benefits.
- Add to Cart: Make checkout easy.
- Follow Up (if cart abandoned): Email reminder or discount.
- Purchase Complete: Send confirmation and delivery updates.
3. Services Example: New sales process for consultants
If you're a consultant, your sales process flowchart must show more than just meetings and emails. It should clearly guide how you attract, qualify, and convert potential customers into paying clients. A good flow chart of sales process helps you stay consistent and professional.
- Lead Generation: Share blogs, speak at events, or offer free resources to attract inbound leads.
- Initial Contact: Send a personalized email or DM. Follow up with a short discovery call.
- Lead Qualification: Use key questions to filter prospects. Are they decision makers? Do they have budget and timeline?
- Proposal Creation: Draft a tailored plan. Include goals, timelines, and pricing clearly.
- Follow Up & Close: Revisit objections, highlight your value, and ask for the decision.
- Onboarding Paying Customer: Welcome new clients with a kickoff call and roadmap.
Types of Sales Process Flowcharts

1. Linear Sales Process Flowchart
This flowchart shows steps in a straight line, from start to finish. It is perfect for a typical sales process that moves step by step.
For example, the chart might start with lead generation, move to qualified leads, and end with closing deals. This simple style works well for new sales reps learning a well-defined sales process.
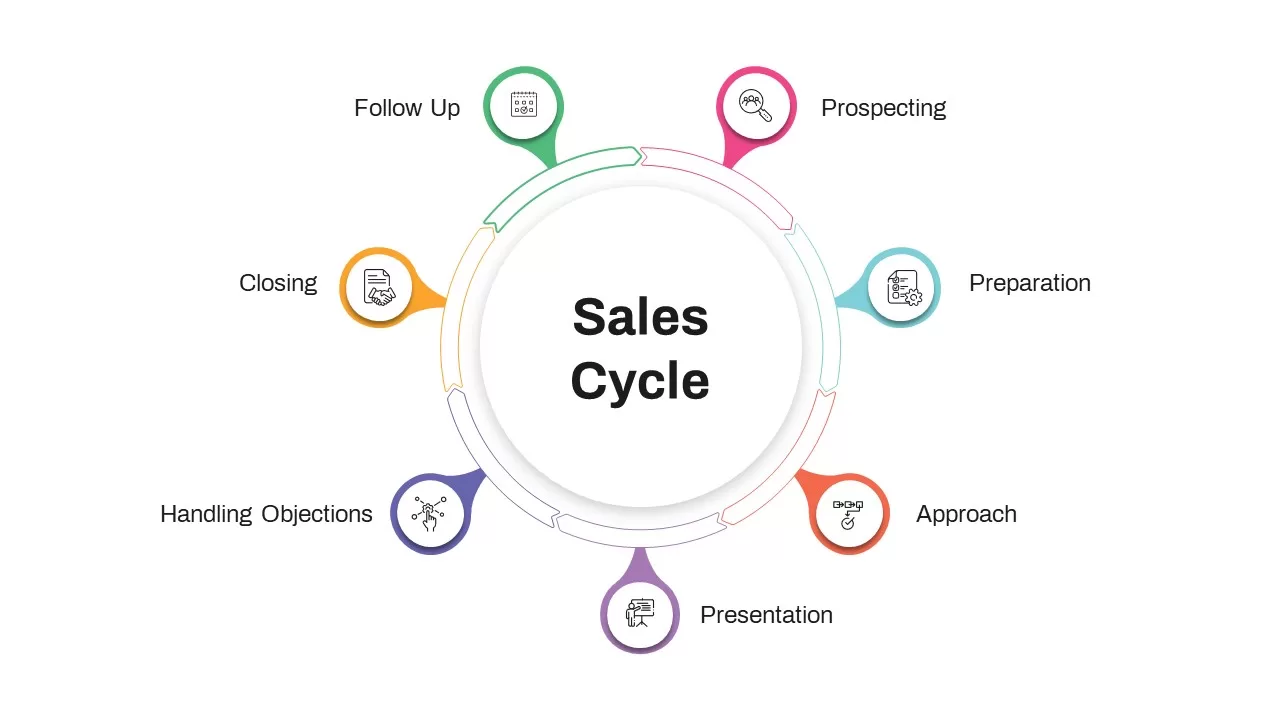
2. Circular Sales Flowchart
A circular flowchart represents whole sales process as a continuous cycle. This design is great for processes that repeat, such as nurturing potential customers over time. It’s often used by marketing teams working closely with sales teams to ensure no leads are missed.
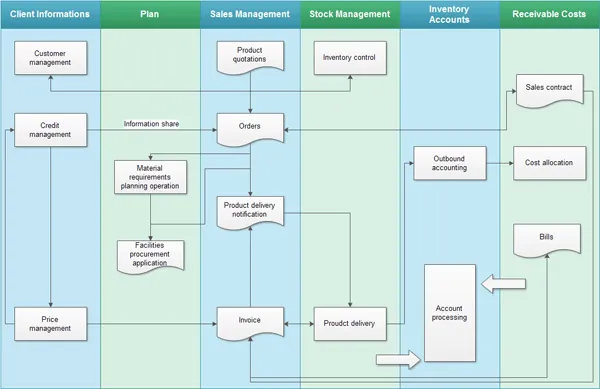
3. Swimlane Sales Flowchart
A swimlane flowchart organizes tasks by who is responsible for each step. It divides the process into lanes for sales reps, sales managers, or even customer success teams.
This is helpful when multiple teams are involved in the sales process. For instance, one lane of sales organization might focus on generating leads, while another handles follow-ups.
4. Decision-Based Flowchart
This flowchart includes yes/no decisions, showing alternate paths based on outcomes. For example, if a lead is not qualified, it redirects back to the prospecting stage. It’s ideal for businesses needing a flexible sales strategy that adjusts to different scenarios.

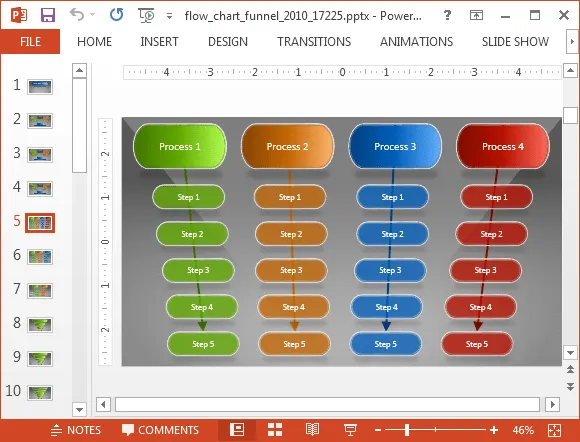
5. Funnel-Shaped Flowchart
A funnel-shaped flowchart narrows down steps, similar to how most sales processes move from many leads to a few closed deals. This type is great for tracking the sales cycle and ensuring no opportunity is lost.
Tools You can Use for Creating a Sales Process Flowchart
1. Lucidchart
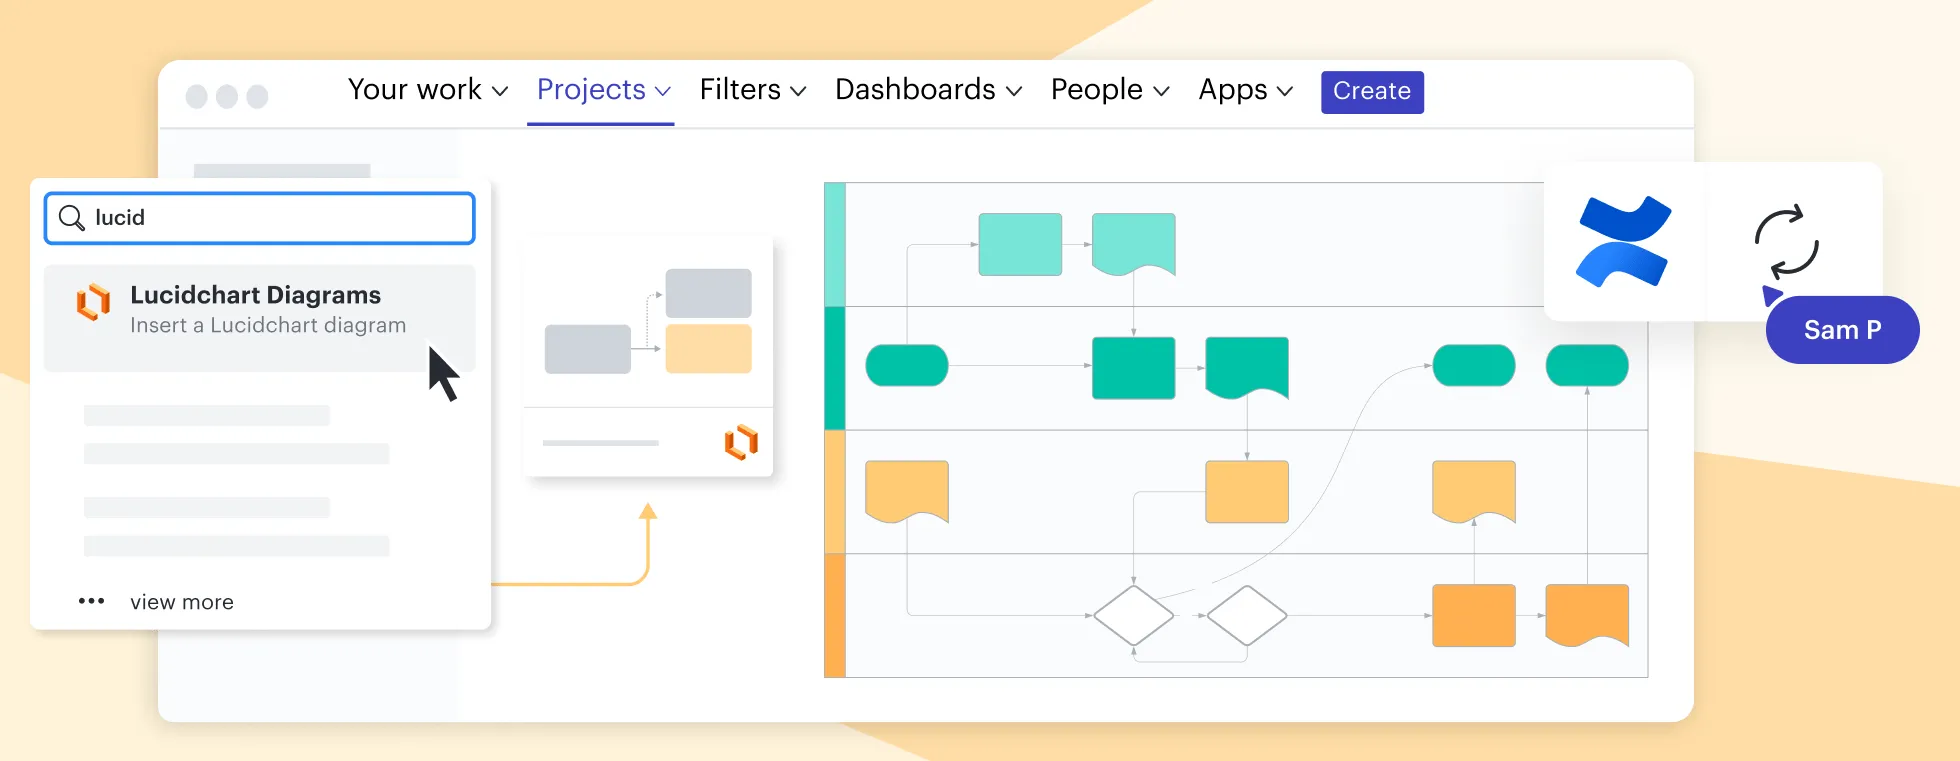
Lucidchart is a favorite tool for making a sales process flowchart that’s easy to read and share.
Key Features:
- Drag-and-drop shapes to build your sales process steps
- Templates made for lead generation, initial contact, and even proposal creation
- Lets sales managers and the marketing team work together
How to Use:
- Sign up for free at Lucidchart.com
- Choose a sales flowchart template
- Add your sales reps, decision makers, and other stages like follow up or closing deals
Pricing:
- Free basic plan
- Paid plans start at $7.95/month
“Lucidchart helps visualize even the most complex sales cycle in minutes.” — Capterra User Review
2. Canva
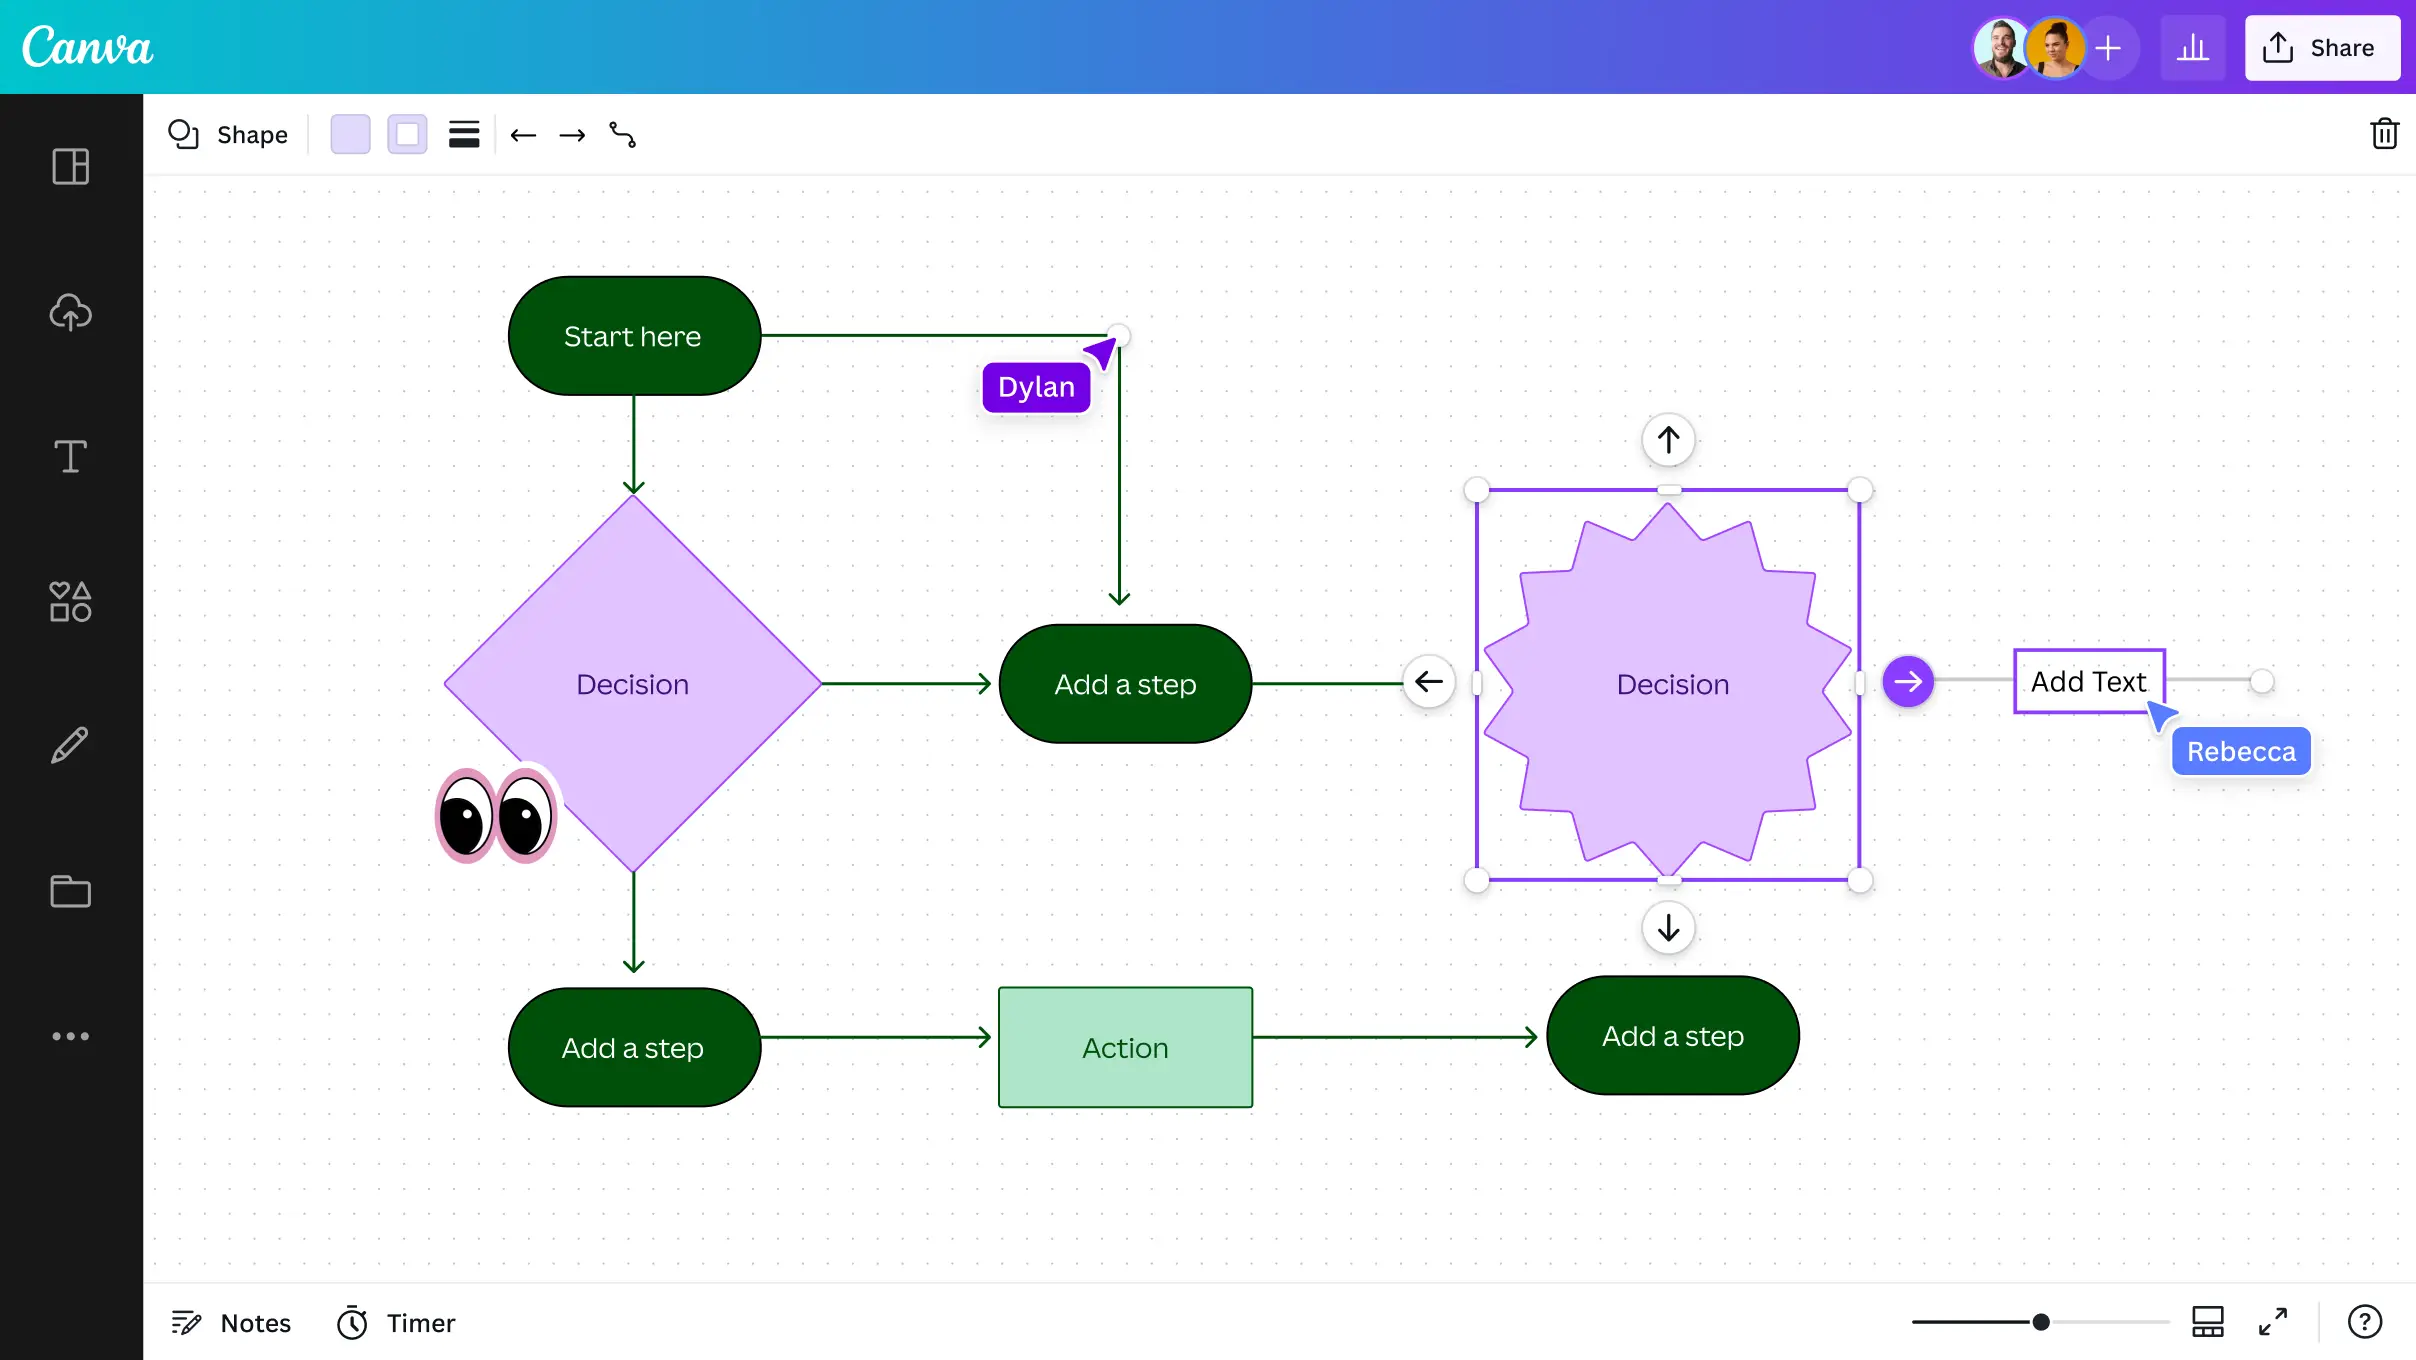
Canva isn’t just for pretty posters. It’s great for building a simple sales process visual too!
Key Features:
- Easy drag-and-drop design
- Pre-made sales process flow templates
- Lets you add icons for prospective customers or highlight pain points
How to Use:
- Go to Canva.com
- Search “Sales Flowchart”
- Edit it to fit your current sales process and add team names
Pricing:
- Free forever plan
- Pro starts at $12.99/month (includes premium templates)
3. Miro
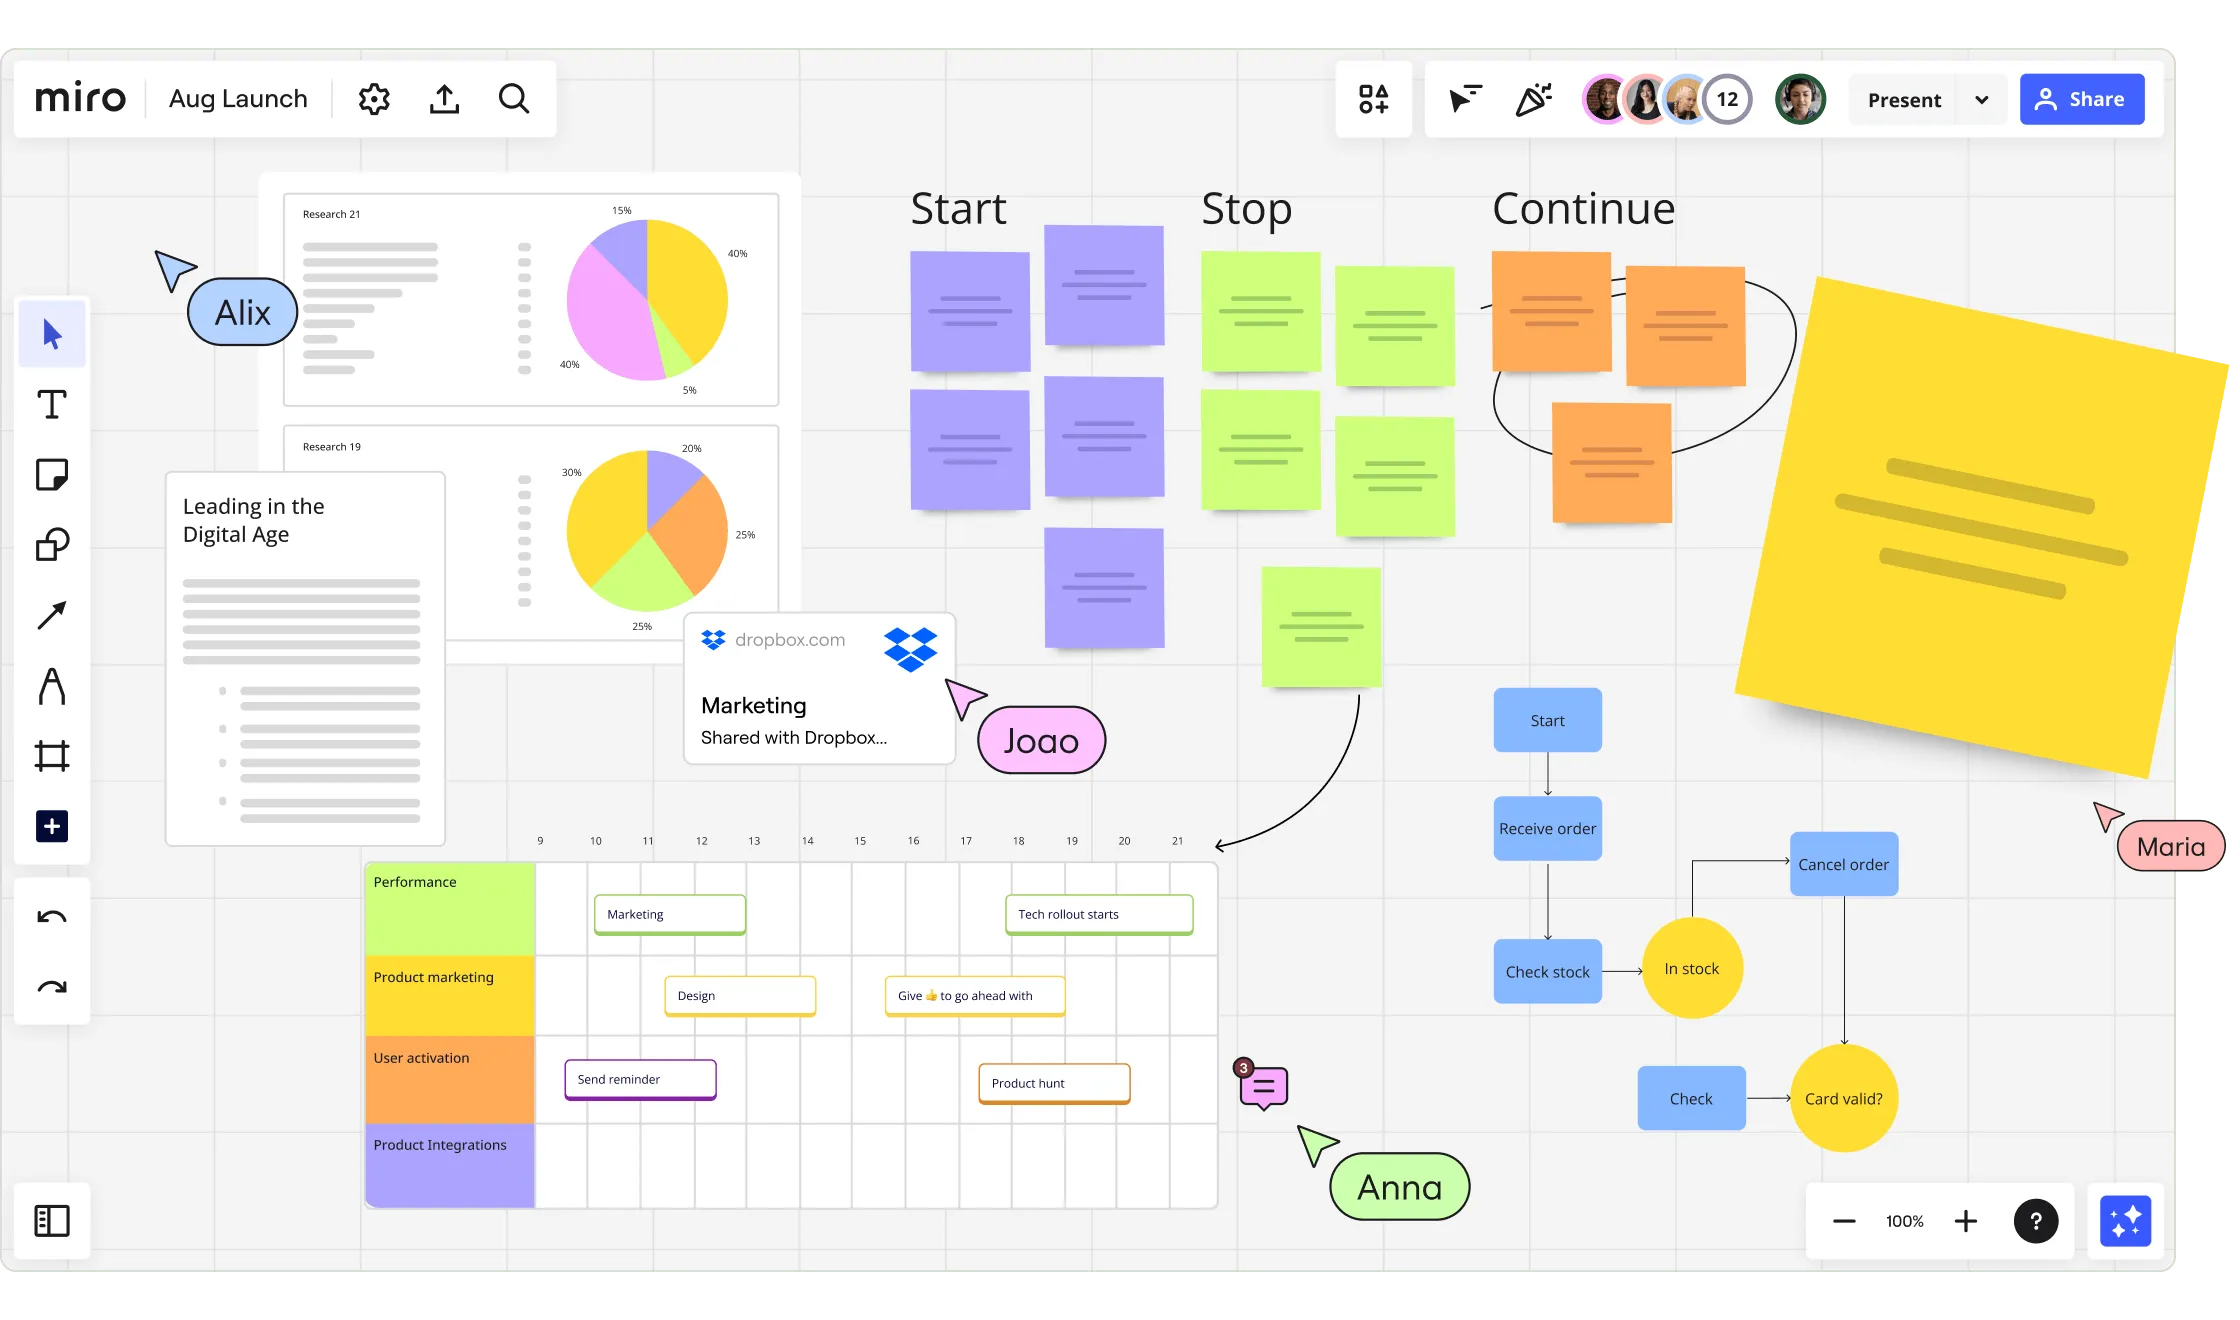
Miro is a smart whiteboard tool. It’s great for teams who want to draw out their sales process diagram and work together in real-time.
Key Features:
- Drag-and-drop shapes for every step in the sales cycle
- Live teamwork—your sales reps and marketing team can edit together
- Templates for sales process flowchart, sales pipeline, and follow up
How to Use:
- Visit Miro.com
- Choose a sales flowchart or create your own
- Add steps like initial contact, proposal creation, and qualified leads
Pricing:
- Free for small teams
- Paid plans start at $8/user/month
"Miro helped us cut planning time by 40%—our sales organization now stays on the same page.” – Sales Manager, HubSpot Review
4. Microsoft Visio
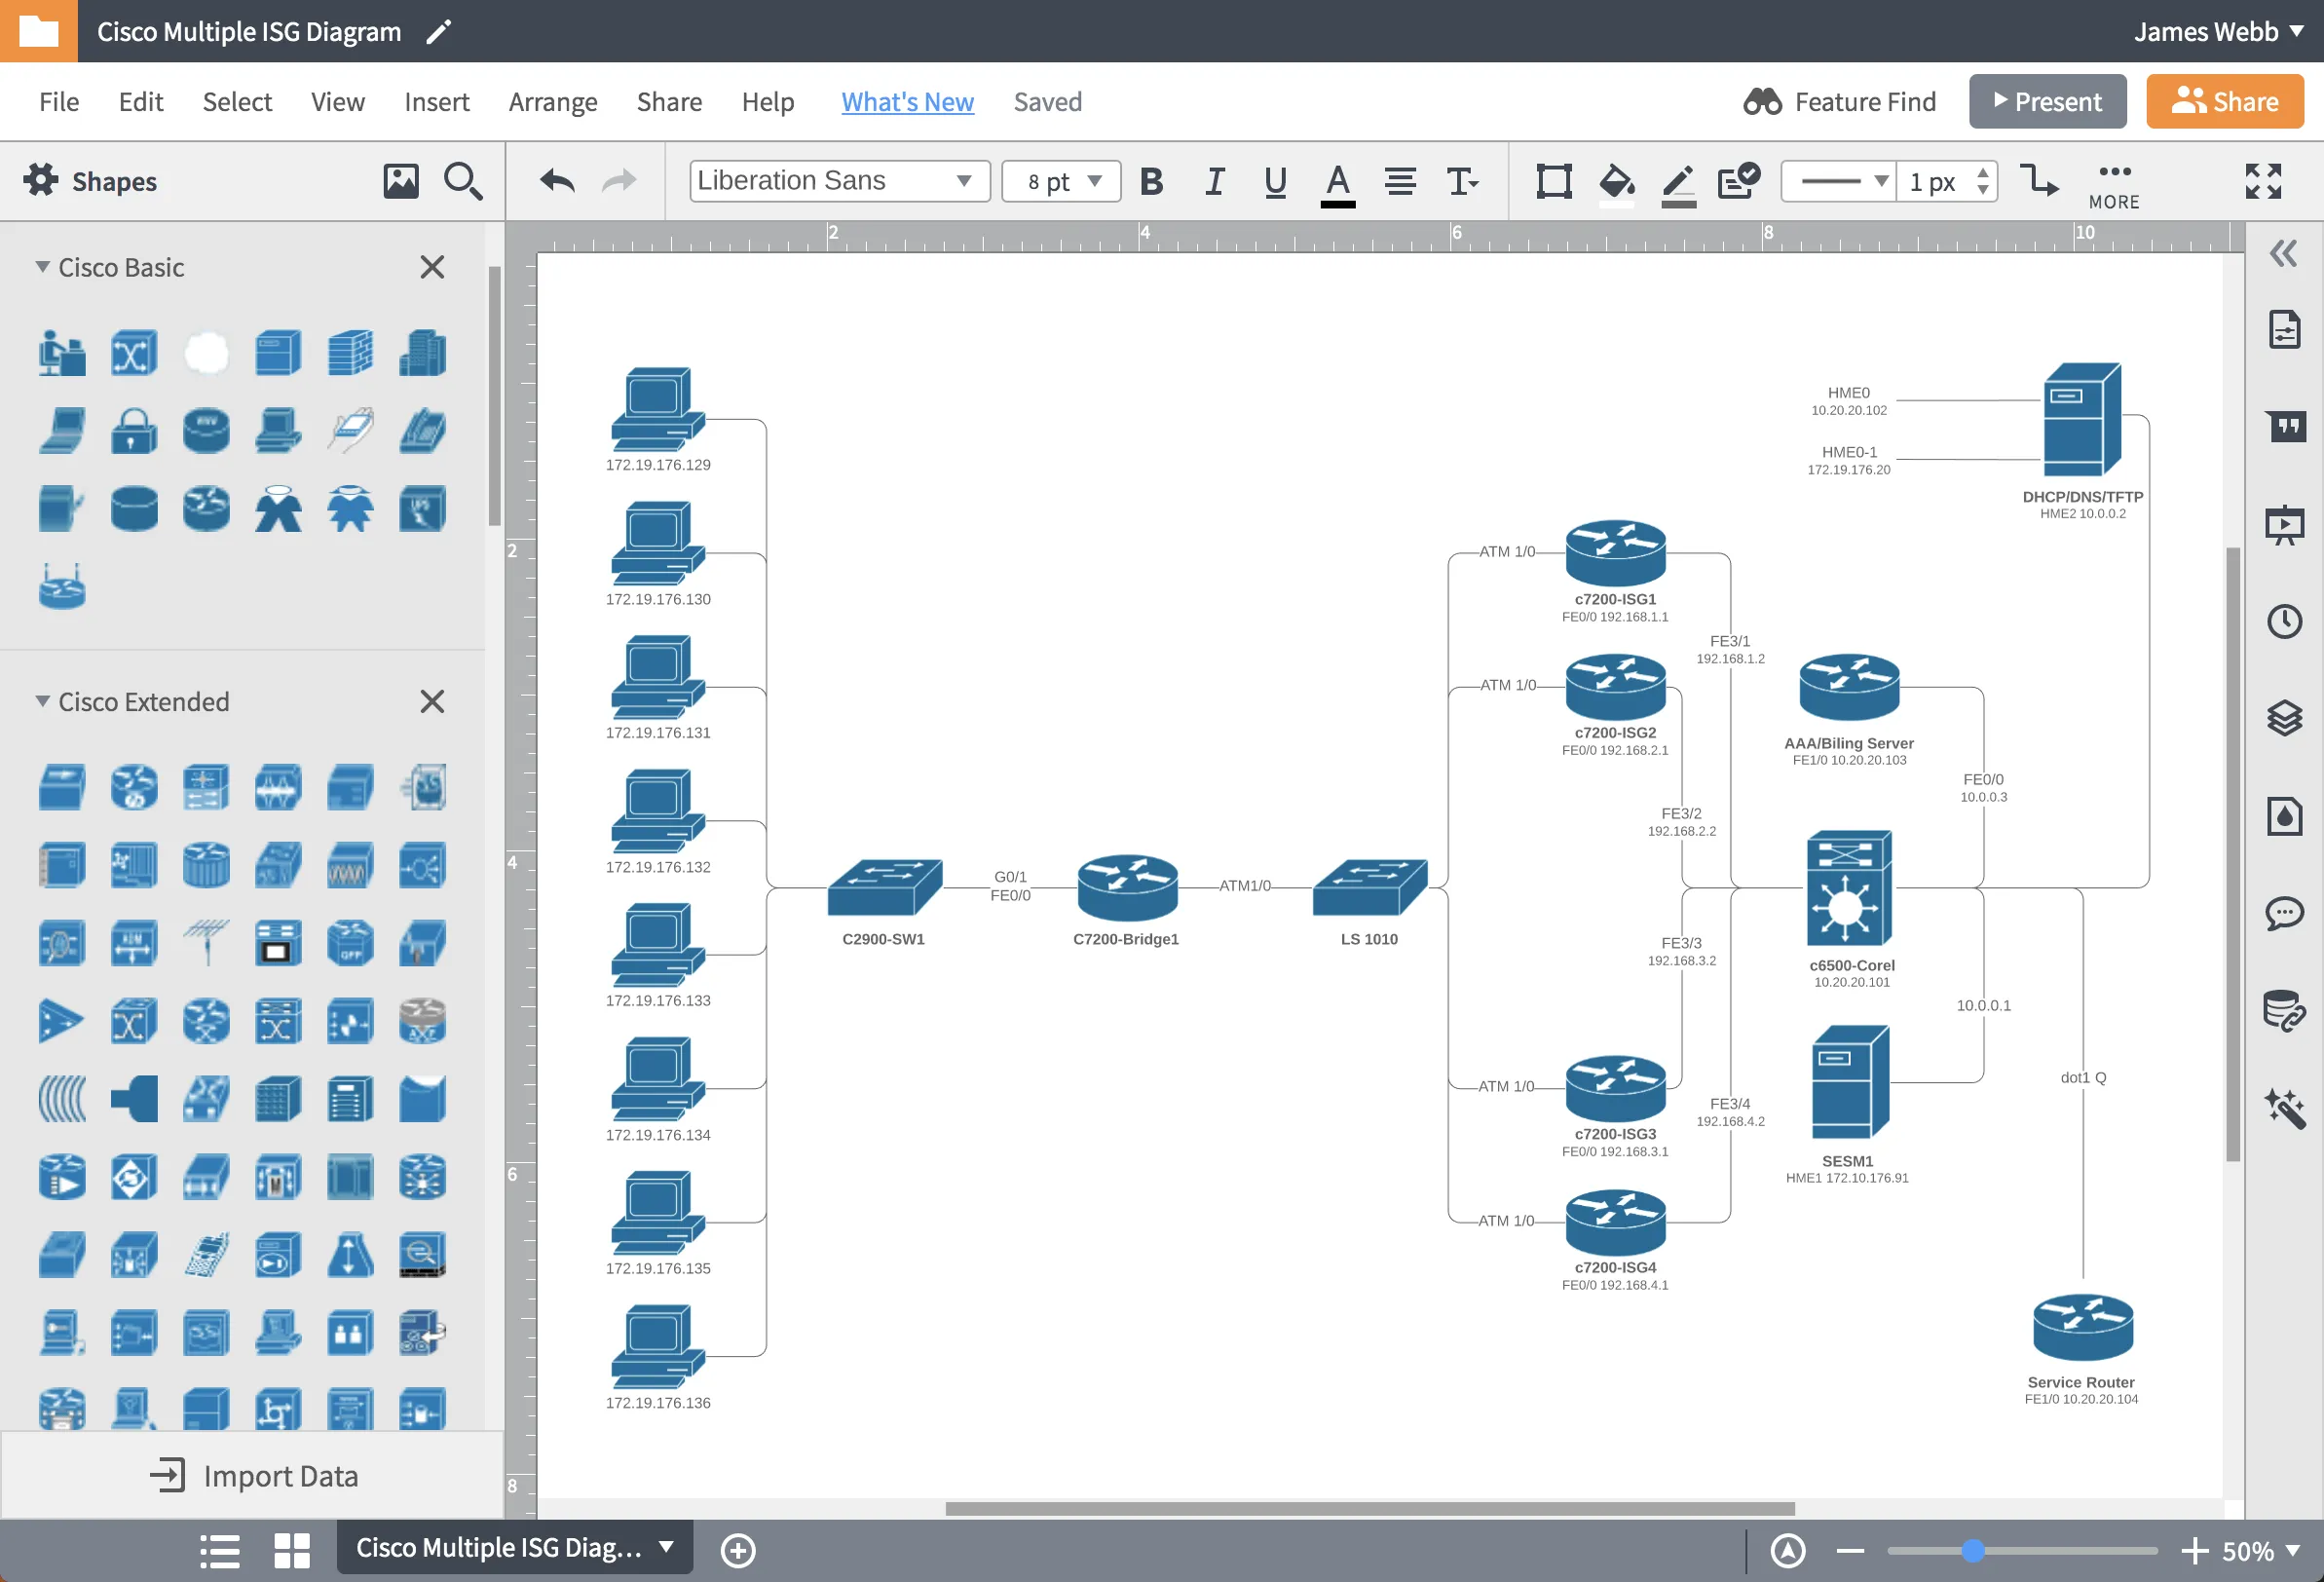
Visio is a tool by Microsoft that helps you build clean and professional sales process diagrams.
Key Features:
- Smart shapes to show each part of the sales process flow
- Great for corporate or enterprise sales teams
- Lets you show links between steps like prospecting stage and decision makers
How to Use:
- Go to Visio.Microsoft.com
- Start with a sales process mapping template
- Insert steps like team’s efforts, pain points, and conversion rates
Pricing:
- Starting at $5/user/month for the web version
- Desktop version costs more, ideal for larger teams
5. Whimsical
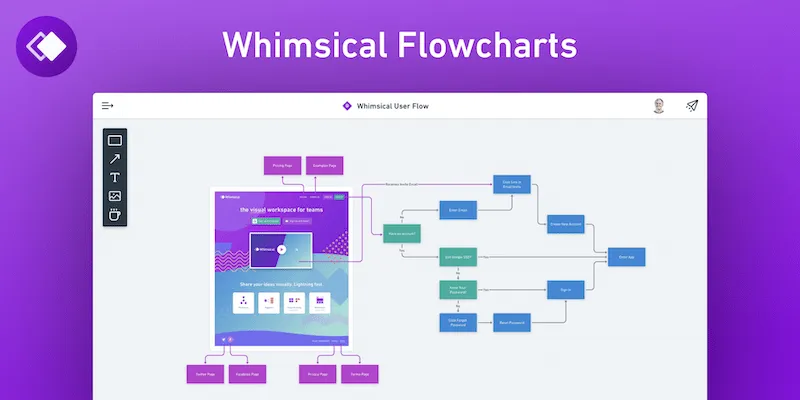
Whimsical is a fun and fast tool to create a clean flow chart of sales process. It’s perfect if you want a simple layout that your whole sales team can follow.
Key Features:
- Clean, no-clutter interface
- Ready templates for sales flowchart, proposal creation, and more
- Easy drag-and-drop for better visual representation
How to Use:
- Go to Whimsical.com
- Pick a sales process mapping template
- Add steps like initial contact, decision makers, and follow up
Pricing:
- Free for up to 100 items
- Paid plans start at $10/month
“Whimsical helped our sales professionals plan faster and close smarter.” – SaaS Startup Review
Conclusion
Using a flow chart of sales process makes your work easier. It helps your sales team follow a clear sales process flow. Tools like Whimsical or Lucidchart let you map each step—from first contact to closing deals. A good chart shows your sales methodology and how it fits your prospect’s business. This makes it simple for sales reps to stay focused. It saves time and boosts results.
Ready to build your own? Start with one step today.



.png)

